Regarding today's economic calendar, market volatility, primarily in dollar quotes, will rise again at 13:15 (GMT) when the ADP report on private sector employment is released, which suggests an increase of 400,000 new workers in December (against an increase of 534,000 in November, 571,000 in October, 568,000 in September, 374,000 in August, 330,000 in July). Despite the relative decline in the indicator, this is strong data, indicating the continued recovery in the US labor market after falling in spring 2020. Although the ADP report does not have a direct correlation with the official report of the US Department of Labor, however, it is considered a harbinger of it. According to the monthly report of the US Department of Labor, expected on Friday, the average hourly wages rose by another +0.4% in December (after an increase in November by +0.3%), the number of new jobs created outside the agricultural sector amounted to 400,000 (after rising 200,000 in November and 531,000 in October), while the unemployment rate fell to a new pandemic low of 4.1%. These are still strong indicators, indicating a continuing improvement in the situation in the US labor market after its landslide in the first half of 2020 (data on the labor market, along with data on inflation and GDP, are key for the Fed when deciding on monetary policy).
And so far, the leaders of the Fed still have reasons to start a cycle of raising interest rates this spring. We will probably find out more about their opinions on this matter today, when the minutes from the December Fed meeting will be published at 19:00 (GMT).
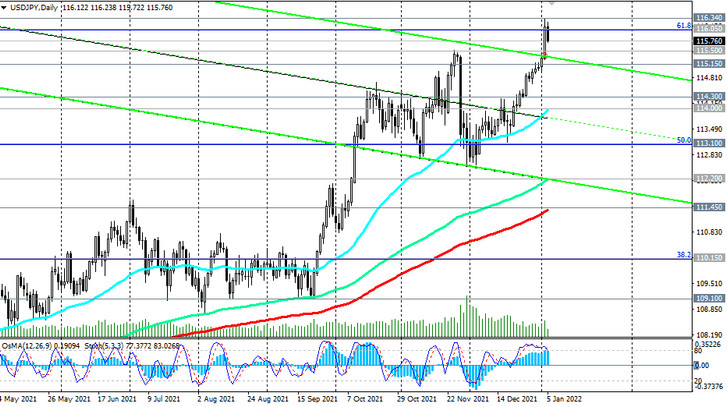
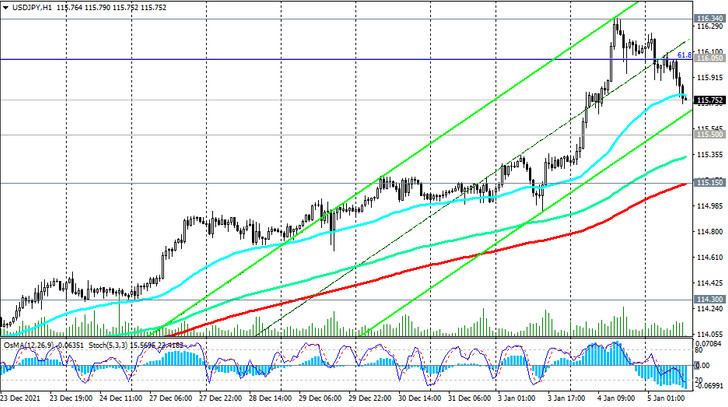
Returning to the dynamics of the yen and the USD / JPY pair. If USD / JPY resumes growth, we would place a buy stop just above the local high of 116.10 with a restrictive stop just below the local support level of 115.50 (November highs).

In an alternative scenario, the first sell signal will be a breakdown of the local support level of 115.50, and a confirmation signal - an important short-term support level of 115.15 (ЕМА200 on the 1-hour chart).

Support levels: 115.50, 115.15, 114.30, 114.00, 113.10, 112.20, 111.45, 110.15, 109.10, 109.25, 109.12, 108.86, 108.55, 108.00, 107.00, 106.75, 106.50, 106.00
Resistance levels: 116.05, 116.24, 116.34, 117.00
Trading scenarios
Buy Stop 116.15. Stop Loss 115.40. Take-Profit 116.24, 116.34, 117.00, 118.00, 120.00
Sell Stop 115.40. Stop Loss 116.15. Take-Profit 115.15, 114.30, 114.00, 113.10, 112.20, 111.45, 110.15, 109.10


