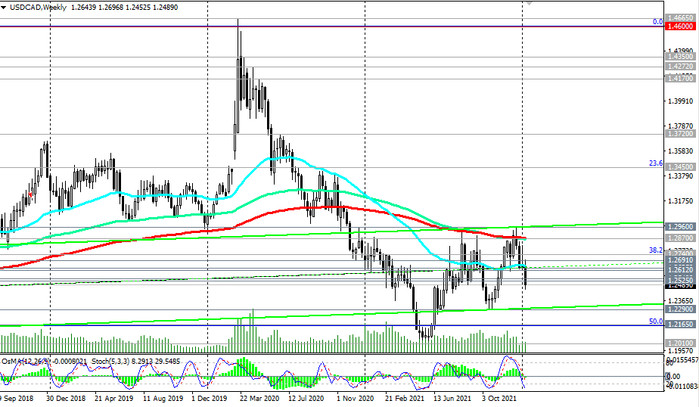
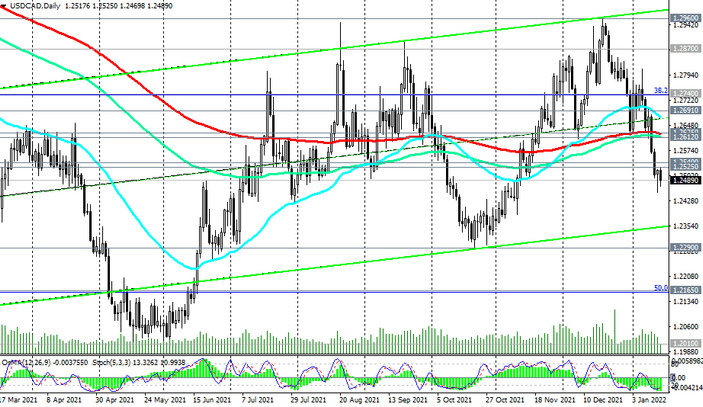
As for the USD/CAD pair, it continues to decline today, trying to gain a foothold in the zone below the key long-term support level 1.2540 (200-period moving average on the monthly chart). In case of its further decline, the targets become support levels 1.2290 (October 2021 lows), 1.2165 (Fibonacci 50% of the downward correction in the USD/CAD growth wave from 0.9700 to 1.4600), 1.2010 (2021 lows). So far, this is the most likely scenario: oil and gas prices are rising, the US dollar, quotes of which has already included 3 Fed interest rate hikes this year, is declining.

In an alternative scenario, the first signals for buying USD/CAD will be a price breakout into the zone above the resistance levels 1.2525 (local highs), 1.2540. A price return to the zone above long-term resistance 1.2625 (200-period moving average on the daily chart) will create conditions for further growth towards the resistance level 1.2870 (200-period moving average on the weekly chart), a break of which will return USD/CAD to the bull market zone.

In the meantime, short positions remain preferable. A break of yesterday's low at 1.2453 will be a signal to strengthen the USD/CAD short position.
As for today's news, which will cause volatility in the market and, first of all, in USD quotes, and hence the USD/CAD pair, it is worth paying attention to the publication of retail sales data in the US at 13:30 (GMT) and at 15:00 - consumer confidence index from the University of Michigan.
The change in retail sales is the main indicator of consumer spending, and it is one of the main components in calculating a country's GDP. In the previous month (November), the value of the indicator was +0.3% (after an increase of +1.8% in October, +0.8% in September, +0.9% in August), which indicates that the improvement is still unstable in this sector of the American economy. The report is expected to point to zero growth in December, despite the period of pre-New Year purchases, and this is a disappointing factor for the USD.
The University of Michigan consumer confidence index, in turn, reflects the confidence of American consumers in the economic development of the country. A high level indicates economic growth, while a low level indicates stagnation. Previous indicator values: 70.6 in December, 67.4 in November, 71.7 in October, 72.8 in September 2021. The data shows uneven recovery of this indicator, which is negative for the USD. Data worse than previous values may have a negative impact on the dollar in the short term. Preliminary forecast for January: 70.
Support levels: 1.2453, 1.2290, 1.2165, 1.2010
Resistance levels: 1.2525, 1.2540, 1.2612, 1.2625, 1.2691, 1.2740, 1.2870, 1.2900, 1.2960
Trading scenarios
Sell Stop 1.2450. Stop Loss 1.2550. Take-Profit 1.2400, 1.2290, 1.2165, 1.2010
Buy Stop 1.2550. Stop Loss 1.2450. Take-Profit 1.2600, 1.2612, 1.2625, 1.2691, 1.2740, 1.2870, 1.2900, 1.2960


