At the moment, NZD/USD is in the bear market zone, trading below the key resistance levels 0.6865 (EMA200 on the weekly chart and the Fibonacci 23.6% correction in the global wave of the pair's decline from the level 0.8820), 0.6950 (EMA200 on the daily chart).
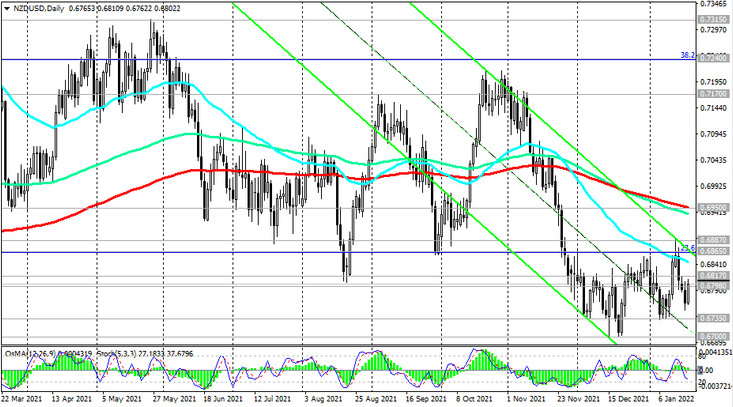
In December, NZD/USD hit a new 13-month low at 0.6700, but then corrected, now trading in a range between 0.6865 and 0.6735. The breakdown of the local support level of 0.6735 will be a signal to build up short positions.
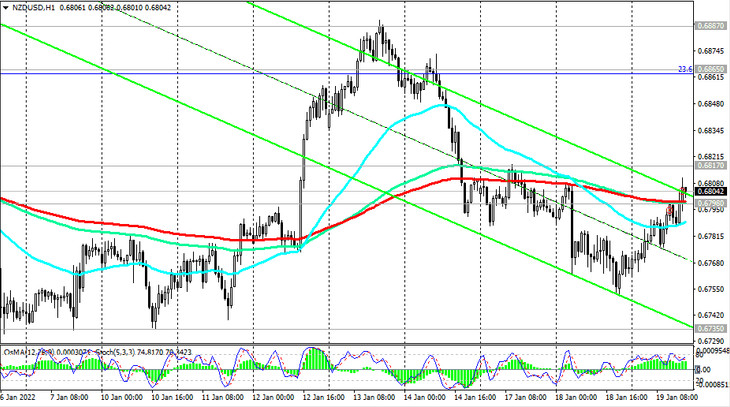
In an alternative scenario, and after the breakdown of the resistance level 0.6865, NZD/USD will head towards the resistance levels 0.6950, 0.7100, 0.7170. More distant growth targets are located at the resistance levels 0.7240 (Fibonacci 38.2%), 0.7430, 0.7550 (Fibonacci 50%), 0.7600, and the first signal for the implementation of this scenario may be a breakdown of the important short-term resistance level 0.6798 (EMA200 at 1- hourly chart).
In the current situation, the determining factor in the dynamics of NZD/USD is likely to be the course of the monetary policy of the central banks of the United States and New Zealand. And, most likely, the conditional "scale" will tilt towards the currency of the country whose central bank takes a tougher stance. In general, the downward dynamics of NZD/USD prevails.
Support levels: 0.6735, 0.6700
Resistance levels: 0.6798, 0.6817, 0.6865, 0.6887, 0.6950, 0.7100, 0.7170, 0.7240, 0.7315, 0.7380, 0.7430, 0.7550, 0.7600
Trading recommendations
Sell Stop 0.6750. Stop Loss 0.6820. Take-Profit 0.6735, 0.6700, 0.6600, 0.6500, 0.6260
Buy Stop 0.6820. Stop Loss 0.6750. Take-Profit 0.6865, 0.6887, 0.6950, 0.7100, 0.7170, 0.7240, 0.7315, 0.7380, 0.7430, 0.7550, 0.7600