Meanwhile, against the backdrop of the dollar weakening, GBP/USD has been developing an upward correction since the end of last month, heading towards the key resistance level 1.3580 (EMA200 on the daily chart and ЕМА50 on the weekly chart).
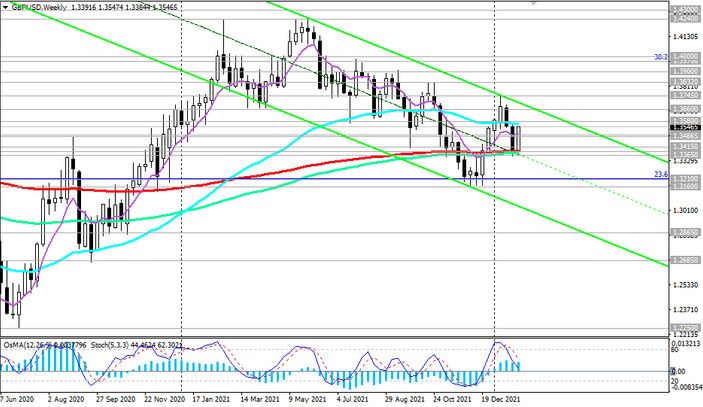
In case of further growth of GBP/USD and a breakdown of the resistance level 1.3580, the target will be the local resistance level 1.3660 (local highs and the upper limit of the descending channel on the weekly chart). A breakdown of the local resistance level 1.3745 may again increase the risks of breaking the GBP/USD bearish trend, sending the pair towards the highs of 2021 and the level 1.4200.
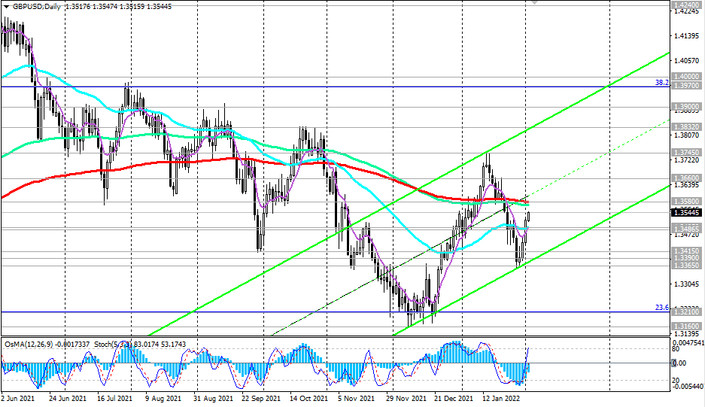
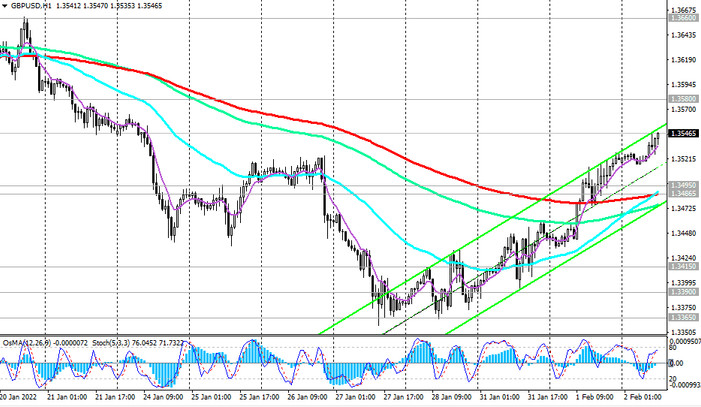
Despite the upward correction, the GBP/USD is in a global downtrend, which is clearly visible on the monthly price chart. In case of breakdown of support levels 1.3495 (EMA200 on the 4-hour chart, EMA50 on the daily chart), 1.3485 (EMA200 on the 1-hour chart), the targets will be local support levels 1.3415, 1.3390, 1.3365, and in case of their breakdown - the levels 1.3210 (Fibonacci level 23.6% of the correction to the decline of the GBP/USD pair in the wave that began in July 2014 near the level of 1.7200), 1.3160 (2021 lows).
A breakout of these levels may finally return the GBP/USD to the bearish market zone and send the pair deep into the downward channel on the weekly chart with targets at the local support levels 1.2865, 1.2685. More distant decline targets are at 1.2100, 1.2000.
Support levels: 1.3495, 1.3485, 1.3415, 1.3390, 1.3365, 1.3300, 1.3210, 1.3160, 1.3000, 1.2865, 1.2685
Resistance levels: 1.3580, 1.3660, 1.3700, 1.3745, 1.3832, 1.3900, 1.3970, 1.4000
Trading recommendations
Sell Stop 1.3515. Stop Loss 1.3555. Take-Profit 1.3495, 1.3485, 1.3415, 1.3390, 1.3365, 1.3300, 1.3210, 1.3160, 1.3000, 1.2865, 1.2685
Buy Stop 1.3555. Stop Loss 1.3515. Take-Profit 1.3580, 1.3660, 1.3700, 1.3745, 1.3832, 1.3900, 1.3970, 1.4000

