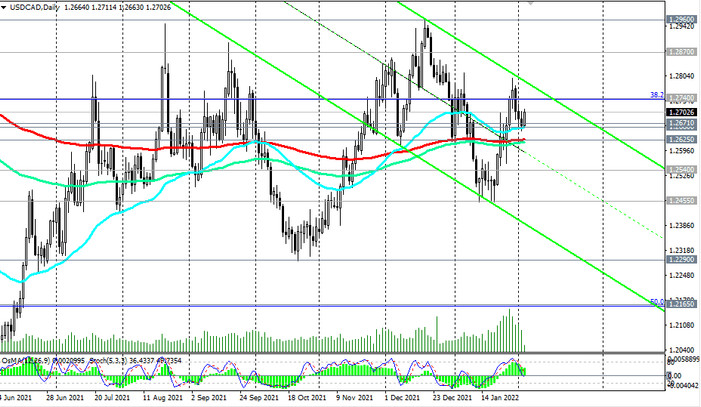
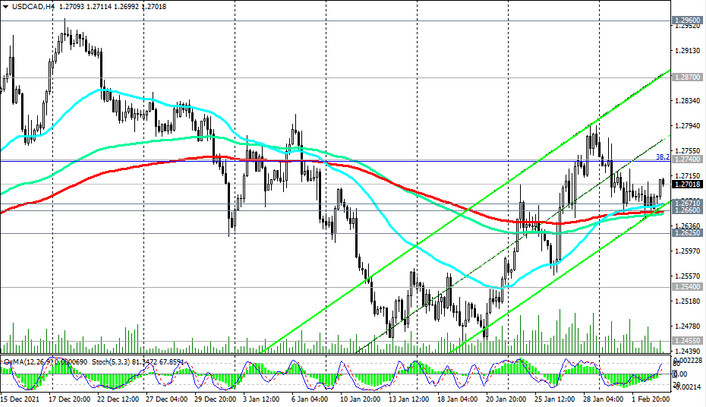
As for the USD/CAD pair, it is growing today after a 3-day decline before. The fall of USD/CAD stopped yesterday at the support level 1.2660 (EMA200 on the 4-hour chart and EMA50 on the daily chart).
Meanwhile, the dynamics of the pair remains without a definite direction. USD/CAD is in the area above the important support level 1.2625 (EMA200 on the daily chart), but below the key long-term resistance level 1.2870 (EMA200, EMA144 on the weekly chart).

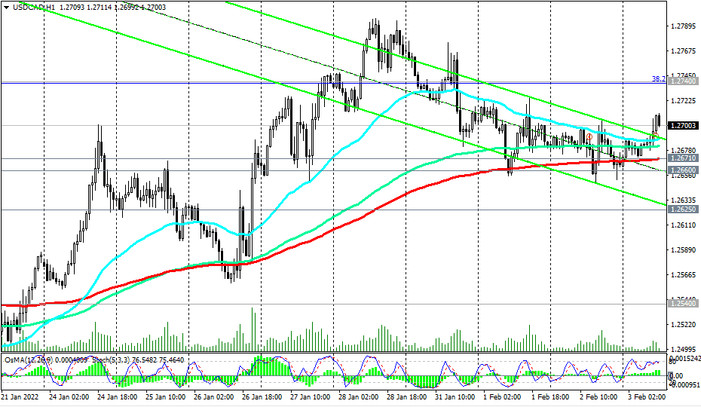
The price is above important short-term support levels 1.2660, 1.2671 (EMA200 on the 1-hour chart), while OsMA and Stochastic indicators recommend long positions. But for now, corrective growth will be limited by the resistance level 1.2870.

The breakdown of the support levels 1.2671, 1.2660 will be a signal for the resumption of short positions. A break of the support level 1.2625 will confirm the resumption of the bearish trend and send USD/CAD towards the local lows 1.2540, 1.2455, 1.2290. A breakdown of the support level 1.2160 (Fibonacci level 50% of downward correction in the USD/CAD growth wave from 0.9700 to 1.4600) will confirm the end of the upward correction from 0.9700 level.

Support levels: 1.2671, 1.2660, 1.2625, 1.2540, 1.2455, 1.2290, 1.2165, 1.2010
Resistance levels: 1.2740, 1.2870, 1.2900, 1.2960
Trading scenarios
Sell Stop 1.2645. Stop Loss 1.2720. Take-Profit 1.2625, 1.2540, 1.2455, 1.2290, 1.2165, 1.2010
Buy Stop 1.2720. Stop Loss 1.2645. Take-Profit 1.2740, 1.2870, 1.2900, 1.2960


