As we noted above, since the opening of today's trading day, oil prices have been rising again. The price of Brent oil is trying to overcome the important short-term resistance level 112.63 (EMA200 on the 1-hour chart).
As we noted above, since the opening of today's trading day, oil prices have been rising again. The price of Brent oil is trying to overcome the important short-term resistance level 112.63 (EMA200 on the 1-hour chart).
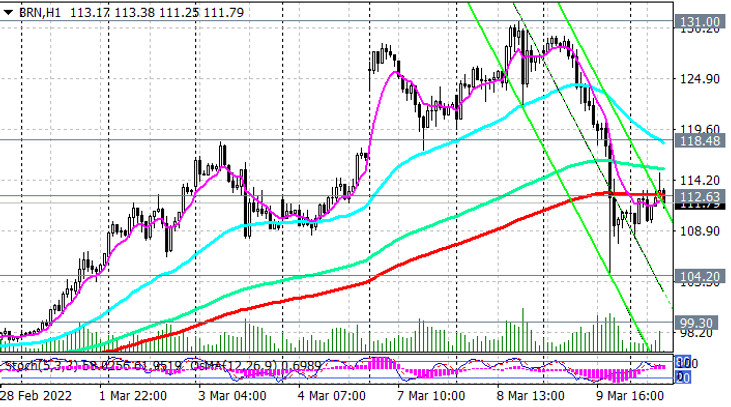
The breakdown of this resistance level is the first signal to resume long positions, and the confirming one is the breakdown of the short-term resistance level 118.48 (EMA200 on the 15-minute chart). The nearest growth target is the recent local highs near the level 131.00. Its breakdown will cause further price growth.
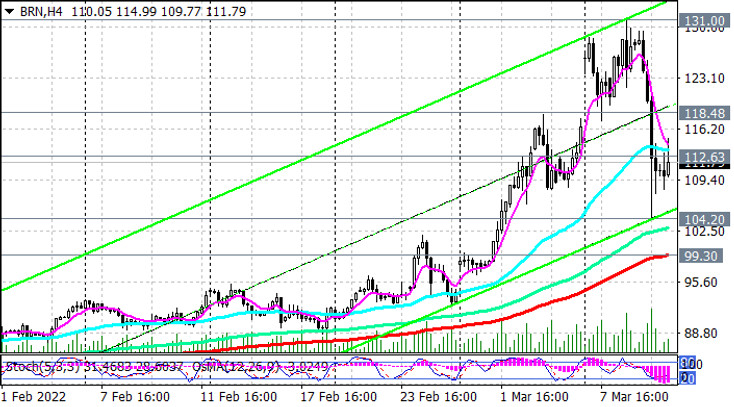
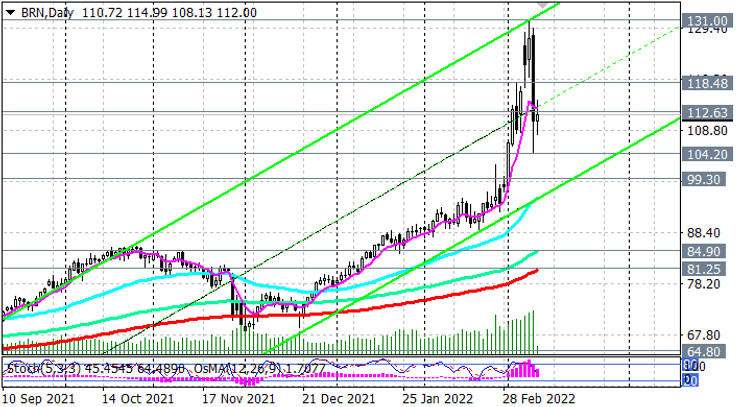
In an alternative scenario, and in case of breakdown of the local support levels 109.50, 104.20, the downward correction may last until the important short-term support level 99.30 (EMA200 on the 4-hour chart), and after its breakdown - to long-term support levels 84.90 (EMA144 on the daily chart), 81.25 (EMA200 on the daily chart). A breakdown of the key support level 64.80 (EMA200 on the weekly chart) will increase the likelihood of a return to a long-term downtrend.
In our main scenario, prices will continue to rise from current levels, and aggressive buyers will probably find it possible to enter the market at current prices.
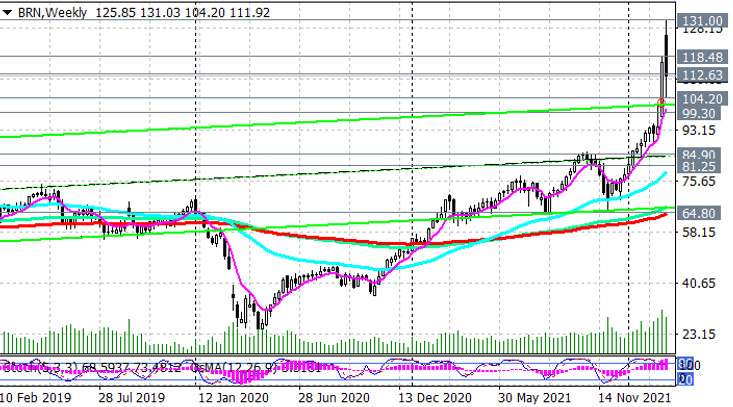
Support levels: 112.63, 109.50, 104.20, 99.30, 84.90, 81.25, 64.80
Resistance levels: 118.48, 131.00
Trading recommendations
Brent: Sell Stop 107.90. Stop Loss 115.10. Take-Profit 104.20, 99.30, 84.90, 81.25, 64.80
Buy Stop 115.10. Stop Loss 107.90. Take-Profit 118.00, 119.00, 120.00, 130.00, 131.00, 140.00
The breakdown of this resistance level is the first signal to resume long positions, and the confirming one is the breakdown of the short-term resistance level 118.48 (EMA200 on the 15-minute chart). The nearest growth target is the recent local highs near the level 131.00. Its breakdown will cause further price growth.
In an alternative scenario, and in case of breakdown of the local support levels 109.50, 104.20, the downward correction may last until the important short-term support level 99.30 (EMA200 on the 4-hour chart), and after its breakdown - to long-term support levels 84.90 (EMA144 on the daily chart), 81.25 (EMA200 on the daily chart). A breakdown of the key support level 64.80 (EMA200 on the weekly chart) will increase the likelihood of a return to a long-term downtrend.
In our main scenario, prices will continue to rise from current levels, and aggressive buyers will probably find it possible to enter the market at current prices.
Support levels: 112.63, 109.50, 104.20, 99.30, 84.90, 81.25, 64.80
Resistance levels: 118.48, 131.00
Trading recommendations
Brent: Sell Stop 107.90. Stop Loss 115.10. Take-Profit 104.20, 99.30, 84.90, 81.25, 64.80
Buy Stop 115.10. Stop Loss 107.90. Take-Profit 118.00, 119.00, 120.00, 130.00, 131.00, 140.00