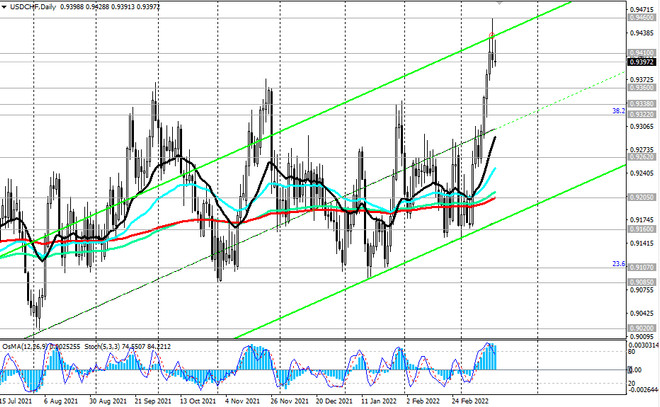
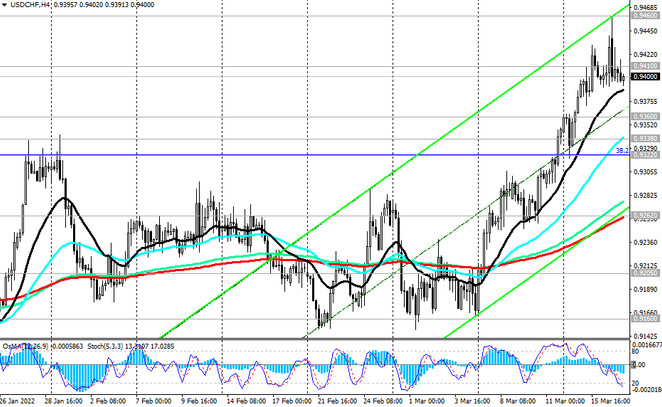
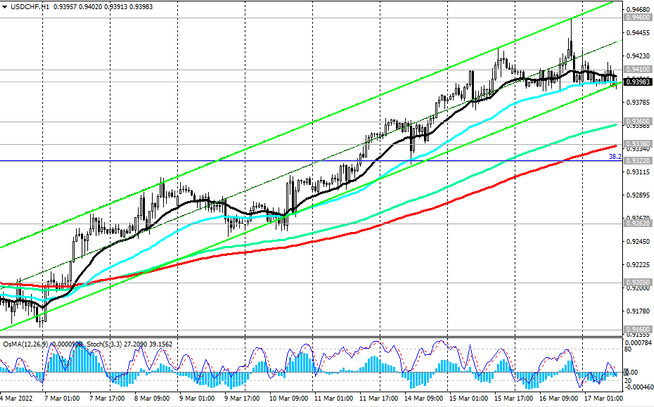
As of this writing, USD/CHF is traded near 0.9395, down from an intraday high of 0.9428 hit during the Asian session.
On Wednesday, the pair attempted to break through the key long-term resistance level 0.9410 (EMA200 on the weekly chart) and reached, as we noted above, an almost 12-month high at 0.9460. If the pair still manages to develop upward dynamics above the level of 0.9410, then this may break the long-term bearish trend of the pair, sending it towards the psychologically significant level 1.0000. The last time USD/CHF was near this mark was in December 2019. Growth of USD/CHF above the resistance level 1.0480 (EMA200 on the monthly chart) will mark the final break into the bull market zone.

In an alternative scenario, the decline in USD/CHF will resume. The first sell signal will be a breakdown of the local support level 0.9360 (the upper limit of the range located between the levels 0.9360 and 0.9100), and the confirming one will be a breakdown of support levels 0.9338 (EMA200 on the 1-hour chart) and 0.9322 (Fibonacci level 38.2% of the correction to the wave decline that began in April 2019 near 1.0235).

Breakdown of the key support level 0.9205 (EМА200 on the daily chart) may again push the USD/CHF into the bearish market.
In the current situation, the main scenario for further growth of USD/CHF is preferable. However, after a confirmed breakdown and consolidation in the zone above the resistance level 0.9410.

Support levels: 0.9400, 0.9360, 0.9338, 0.9322, 0.9262, 0.9205, 0.9160, 0.9107, 0.9085
Resistance levels: 0.9410, 0.9460, 0.9495, 0.9670, 1.0000, 1.0235, 1.0480
Trading recommendations
Sell Stop 0.9380. Stop Loss 0.9440. Take-Profit 0.9360, 0.9338, 0.9322, 0.9262, 0.9205, 0.9160, 0.9107, 0.9085
Buy Stop 0.9440. Stop Loss 0.9380. Take-Profit 0.9460, 0.9495, 0.9670, 1.0000, 1.0235, 1.0480


