As we noted above, the AUD/USD is developing an upward momentum, while the AUD is receiving support from rising commodity prices and some stabilization in the global stock market.
Apparently, AUD/USD will end this week on a positive note, with a gain of more than 1%.
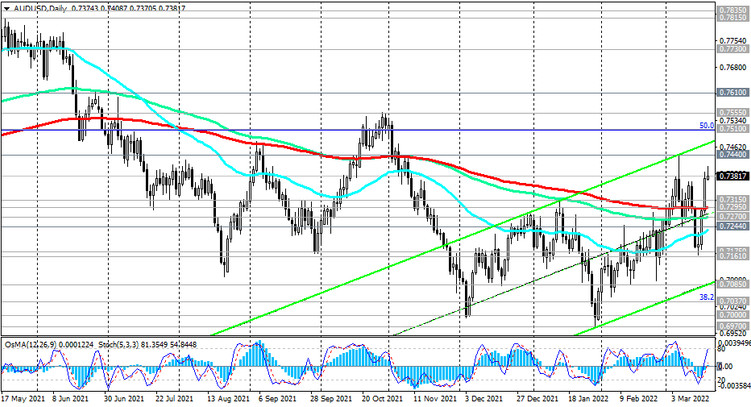
The pair is trying to gain a foothold in the bull market zone, above the key support levels 0.7315 (EMA200 on the weekly chart), 0.7295 (EMA200 on the daily chart).
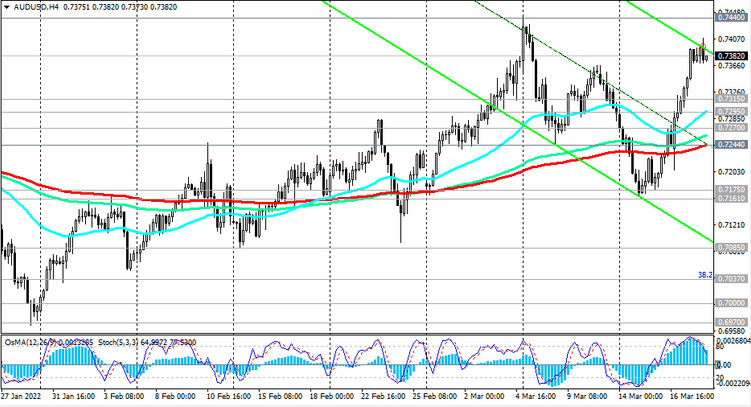
The breakdown of the local resistance level 0.7408 (today's intraday and intraweek maximum) will most likely be a signal to increase long positions, and the nearest target will be the intra-month maximum 0.7440.
But for the final completion of the downward correction and an order to return to the long-term uptrend, the price still has to rise above the resistance level 0.7610 (EMA200 on the monthly chart), i.e. go another 250 points. This is a distance of 2-3 months. According to observers and economists, the pace of tightening monetary policy announced by the Fed is largely already included in the USD quotes.
Therefore, the AUD/USD pair has every chance to over this way. But - provided that strong macro data continue to come from Australia, which will force the RBA to reconsider its plans and start tightening monetary policy, and the demand for the protective US dollar will continue to decline.
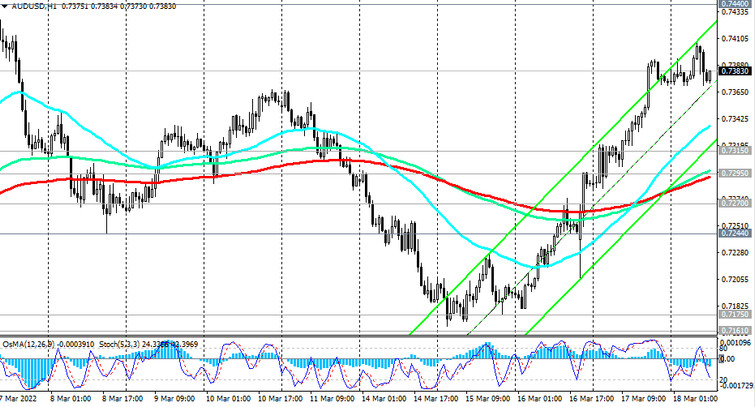
In an alternative scenario, we expect the AUD/USD to decline again, and the first signal for this will be a breakdown of the short-term support level 0.7337 (EMA200 on the 15-minute chart).
Breakdown of long-term support levels 0.7295, 0.7270 (EMA144 on the daily chart) will confirm this scenario, and AUD/USD will head inside the descending channel on the weekly chart and to the levels 0.7037 (Fibonacci level 38.2% of the correction to the wave of the pair's decline from the level 0.9500 in July 2014 to the lows of 2020 near the mark of 0.5510), 0.7000, 0.6930 (the lower limit of the downward channel on the weekly chart) with intermediate targets at the support levels 0.7244, 0.7175, 0.7161, 0.7085.
Support levels: 0.7337 0.7315 0.7295 0.7270 0.7244 0.7175 0.7161 0.7100 0.7085 0.7037 0.7000 0.6970 0.6900 0.6800 0.6455
Resistance levels: 0.7408, 0.7440, 0.7510, 0.7555, 0.7610, 0.7730, 0.7775, 0.7815, 0.7900, 0.8000
Trading Recommendations
Sell Stop 0.7360. Stop Loss 0.7410. Take-Profit 0.7337 0.7315 0.7295 0.7270 0.7244 0.7175 0.7161 0.7100 0.7085 0.7037 0.7000 0.6970 0.6900 0.6800 0.6455
Buy Stop 0.7410. Stop Loss 0.7360. Take-Profit 0.7440, 0.7510, 0.7555, 0.7610, 0.7730, 0.7775, 0.7815, 0.7900, 0.8000