In our previous review, we wrote that “in the main scenario, short positions remain preferable. The signal for their resumption will be a breakdown of the support levels 1.3141, 1.3110”. However, the alternative scenario worked and the recommendation “Buy Stop 1.3180. Stop Loss 1.3130. Take-Profit 1.3210, 1.3275, 1.3308, 1.3365, 1.3390, 1.3430, 1.3515, 1.3580, 1.3640, 1.3700, 1.3745, 1.3832, 1.3900, 1.3970, 1.4000”. We also wrote that "in case of a breakdown of the resistance level 1.3210, the corrective growth may continue to the resistance level 1.3308 (EMA200 on the 4-hour chart)". The scenario was almost completely justified, except for the fact that EMA200 on the 4-hour chart today passes not through 1.3308, but through 1.3297. At the same time, two of our recommended Take-Profits were reached - 1.3210 and 1.3275.
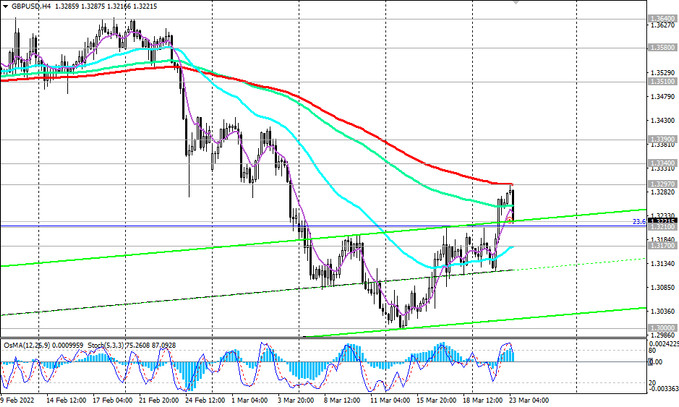
Today we see that during the Asian trading session GBP/USD rose again, reaching the resistance level 1.3297 (EMA200 on the 4-hour chart).
However, after the publication (at 07:00 GMT) of fresh inflationary indicators for the UK, the pound weakened, and the GBP/USD pair bounced off the resistance level 1.3297 and is falling again, reaching 1.3221 by the time this article was published.
Our main scenario still assumes a decline in GBP/USD. The first signal for the resumption of short positions may be a breakdown of the short-term support level 1.3220 (EMA200 on a 15-minute chart) and the support level 1.3210 (Fibonacci 23.6% of the correction to the decline in the GBP/USD pair in the wave that began in July 2014 near the level 1.7200), and confirming - a breakdown of the important support level 1.3170 (EMA200 on the 1-hour chart and the lows of 2021).
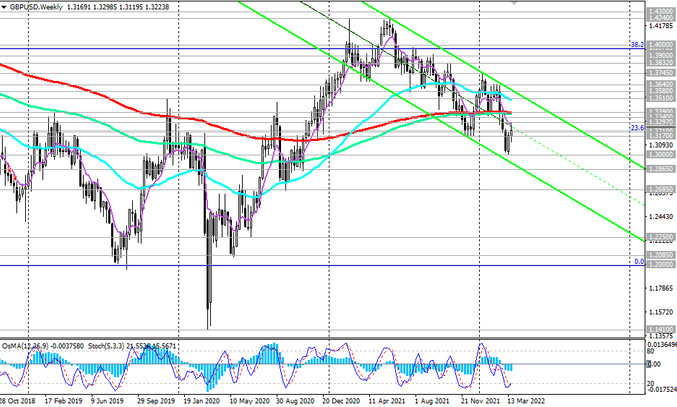
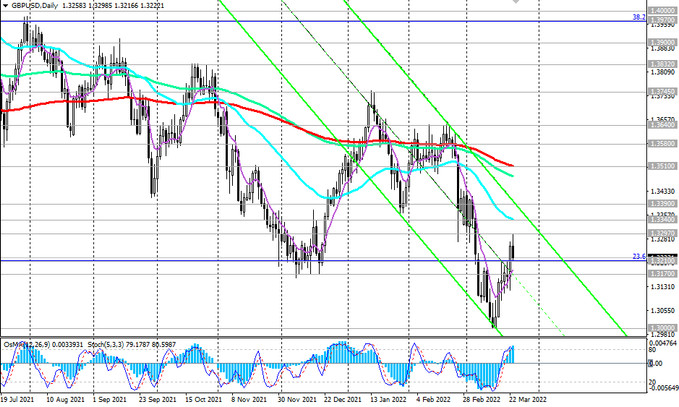
The immediate downside target is 1.2865, through which the lower borders of the descending channels on the daily and weekly charts pass. Breakdown of this support level will strengthen the negative dynamics of GBP/USD, sending the pair towards local lows 1.2685, 1.2400.
In an alternative scenario, and after the breakdown of the resistance level 1.3297, GBP/USD will resume growth. Breakdown of resistance levels 1.3340 (EMA50 on the daily chart), 1.3390 (EMA200 on the weekly chart) will strengthen the upward trend. Breakdown of the key resistance level 1.3510 (EМА200 on the daily chart) may bring GBP/USD back into the bull market zone.
Support levels: 1.3220, 1.3210, 1.3170, 1.3000, 1.2950, 1.2865, 1.2685, 1.2400, 1.2250, 1.2085, 1.2000
Resistance levels: 1.3297, 1.3340, 1.3390, 1.3510, 1.3580, 1.3640, 1.3700, 1.3745, 1.3832, 1.3900, 1.3970, 1.4000
Trading recommendations
Sell Stop 1.3190. Stop Loss 1.3310. Take-Profit 1.3170, 1.3000, 1.2950, 1.2865, 1.2685, 1.2400, 1.2250, 1.2085, 1.2000
Buy Stop 1.3310. Stop Loss 1.3190. Take-Profit 1.3340, 1.3390, 1.3510, 1.3580, 1.3640, 1.3700, 1.3745, 1.3832, 1.3900, 1.3970, 1.4000