As we noted above, the AUD/USD is developing upward dynamics, while the AUD is receiving support from the growth of commodity prices, the growth of global stock indices and positive macro data coming from Australia.
AUD/USD ended the last week on a positive note, with a gain of more than 1.4%.
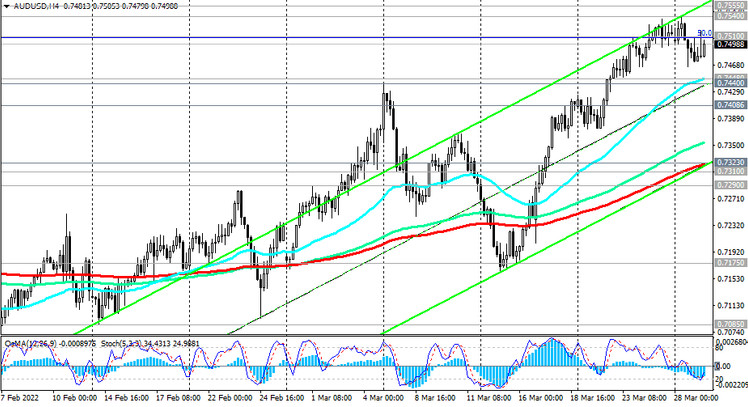
The breakdown of the local highs at 0.7540, 0.7555 will confirm the bullish trend of the pair and direct it towards the key long-term resistance level 0.7610 (EMA200 on the monthly chart), a break of which and further growth can finally bring AUD/USD into the zone of a long-term bull market.
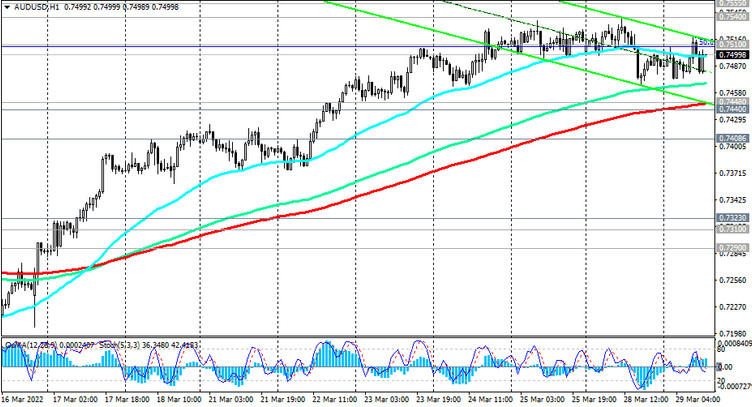
In an alternative scenario, we expect the AUD/USD to decline again. The first signal for this will be the breakdown of the local support level 0.7465, and the confirming one – the support level 0.7448 (EMA200 on the 1-hour chart).
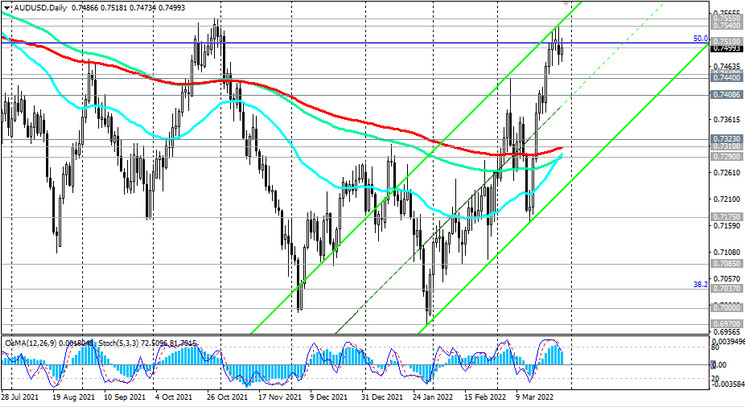
Nevertheless, the decline down to the support levels 0.7310 (EMA200 on the daily chart), 0.7290 (EMA144 on the daily and weekly charts) will be considered corrective.
Only their breakdown will return AUD/USD to the bear market zone.
In the current situation, long positions look preferable.
Support levels: 0.7465, 0.7448, 0.7400, 0.7323, 0.7310, 0.7290, 0.7175, 0.7085, 0.7037, 0.7000, 0.6970
Resistance levels: 0.7510, 0.7540, 0.7555, 0.7610, 0.7730, 0.7775, 0.7815, 0.7900, 0.8000
Trading Recommendations
Sell Stop 0.7460. Stop Loss 0.7520. Take Profit 0.7448, 0.7400, 0.7323, 0.7310
Buy Stop 0.7520. Stop Loss 0.7460. Take-Profit 0.7540, 0.7555, 0.7610, 0.7730, 0.7775, 0.7815, 0.7900, 0.8000