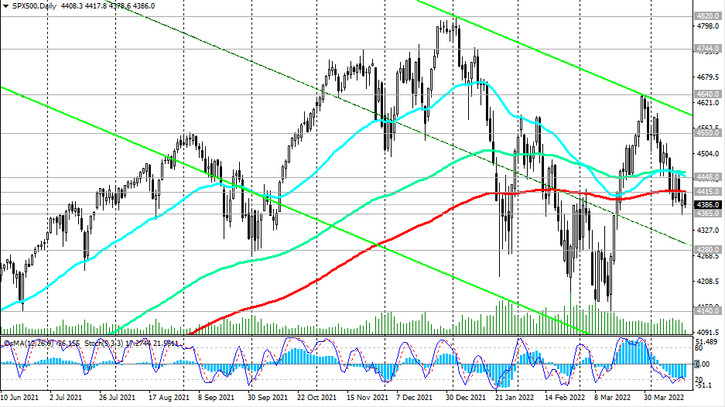
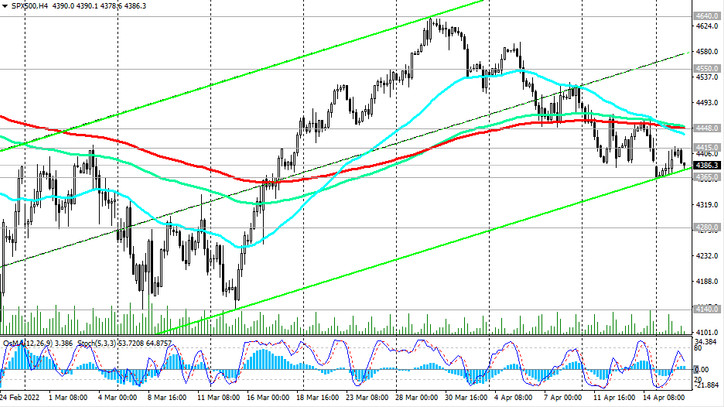
S&P 500 futures have been declining since the beginning of this month and from the open of today's trading day. Having broken through the important support level 4455.0 (EMA200 on the 4-hour chart, EMA144, EMA50 on the daily chart), S&P 500 futures are trying to break through the key support level 4408.00 (EMA200 on the daily chart).

A breakdown of the important support level 4365.00 (EMA50 on the weekly chart) may signal an increase in the downward dynamics of the S&P 500, increasing the risks of a transition to a long-term bear market. However, this is still only a theoretical assumption. One way or another, the US stock market maintains a long-term bullish trend. A return into the zone above the level 4465.00 will be a signal to resume long positions.

Despite the decline, this is our main scenario.
In an alternative scenario, and after the breakdown of the support level 4365.00, the S&P 500 will continue to decline towards the recent local lows 4160.00. A deeper correction will be accompanied by a decline inside the descending channel on the weekly chart. Its lower limit is close to 3900.00. However, above the key support levels 3845.00 (EMA144 on the weekly chart), 3610.00 (EMA200 on the weekly chart), the S&P 500 remains in the long-term bull market zone.
Above the resistance level 4455.00, long positions will become preferable again.
Support levels: 4365.00, 4278.00, 4160.00, 3900.00, 3845.00, 3610.00
Resistance levels: 4408.00, 4455.00, 4540.00, 4630.00, 4810.00
Trading recommendations
Sell Stop 4355.0. Stop Loss 4415.0. Targets 4300.0, 4278.00, 4160.00, 3900.00, 3845.00, 3610.00
Buy Stop 4415.0. Stop Loss 4355.0. Targets 4455.00, 4540.00, 4630.00, 4810.00, 4900.00, 5000.00


