Meanwhile, against the backdrop of a strengthening dollar, gold quotes are declining. Thus, XAU/USD is traded near the 1880.00 mark, approaching the important support levels 1873.00 (EMA144 on the daily chart), 1858.00 (EMA200 on the daily chart), 1851.00 (EMA50 on the weekly chart).
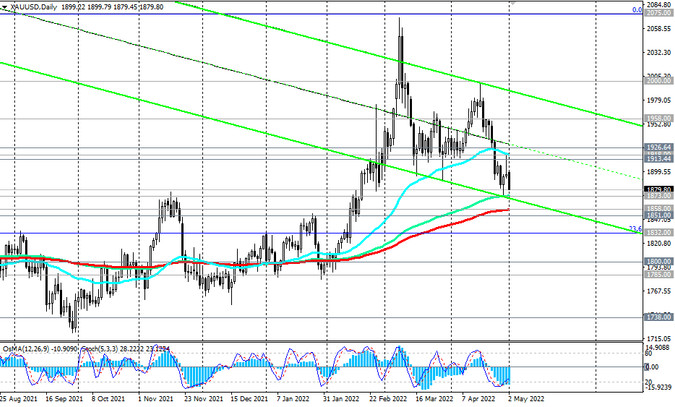
Their breakdown can significantly aggravate the situation and reduce the optimism of buyers of this precious metal. In this case, the risks of a further decline in gold quotes and a fall in XAU/USD towards long-term support levels 1738.00 (EMA144 on the weekly chart), 1672.00 (EMA200 on the weekly chart), which separate the long-term bull market from the bear market, increase.
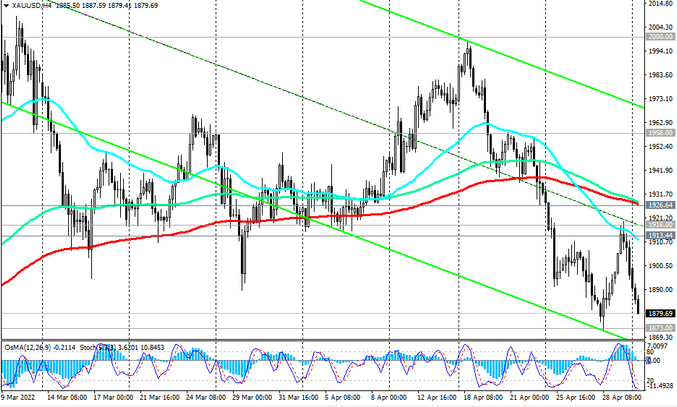
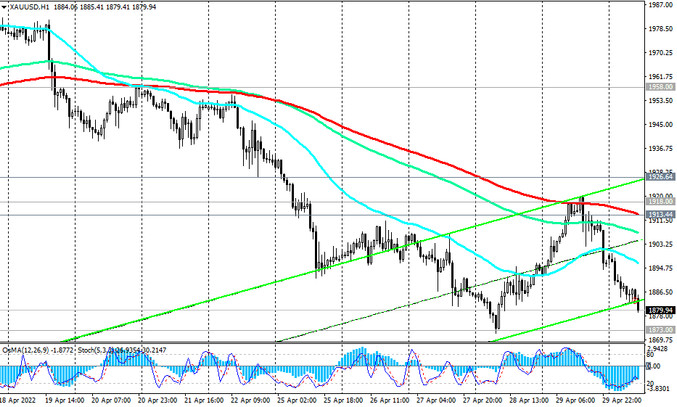
But until the support levels 1858.00, 1851.00 are broken, it is premature to talk about breaking the uptrend. The first signal for the resumption of long positions will be the growth above today's high of 1899.00, and the confirming one will be a breakdown of the resistance levels 1913.00 (EMA200 on the 1-hour chart), 1926.00 (EMA200 on the 4-hour chart).
Support levels: 1873.00, 1858.00, 1851.00, 1832.00, 1800.00, 1785.00
Resistance levels: 1913.00, 1918.00, 1926.00, 1958.00, 2000.00, 2070.00, 2075.00
Trading recommendations
Sell Stop 1869.00. Stop Loss 1902.00. Take-Profit 1858.00, 1851.00, 1832.00, 1800.00, 1785.00
Buy Stop 1902.00. Stop Loss 1869.00. Buy Limit 1873.00, 1860.00, 1851.00. Stop Loss 1845.00. Take-Profit 1913.00, 1918.00, 1926.00, 1958.00, 2000.00, 2070.00, 2075.00