The growth of the dollar and the DXY index today could be stronger. Probably, this growth was restrained by today's meeting of the RBA and its results. As is already known, the Australian central bank today raised interest rates for the first time since November 2010 to curb inflation, which reached a 20-year high. The bank raised its key rate to 0.35% from a record low of 0.10% and signaled the likelihood of further increases in the coming months.
"The Board will do everything necessary to ensure that over time, inflation in Australia returned to the target level - said the governor of the central bank Philip Lowe. - This will require further interest rate hikes in the future."
The central bank now expects headline inflation to be at 6% in 2022, core inflation - to accelerate to 4.75%, and market participants expect the RBA's key rate to rise to around 2.5% by the end of this year.
"With the move towards full employment and data on prices and wages, some scaling back of the emergency monetary support provided during the pandemic is appropriate," Lowe said.
The Australian dollar strengthened after the RBA meeting ended at 04:30 (GMT) and the AUD/USD jumped 100 pips to an intraday high of 0.7146. However, then the pair went down and “drifted” near the support level 0.7085 (EMA200 on the 15-minute chart).
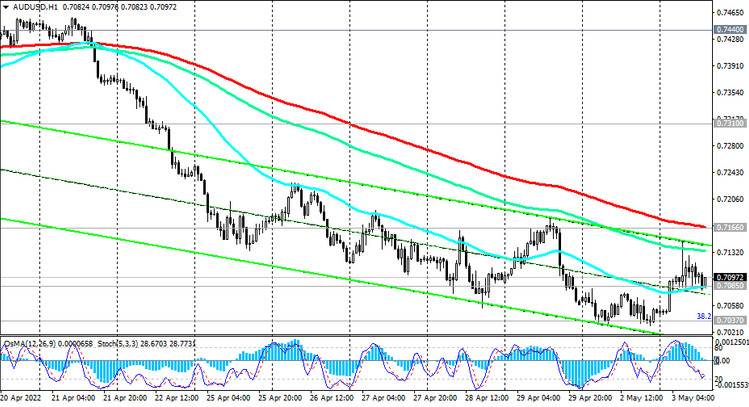
Despite today's growth, AUD/USD has been in a downtrend since the beginning of last month, trading below the key resistance level 0.7310 (EМА200 on the daily and weekly charts).
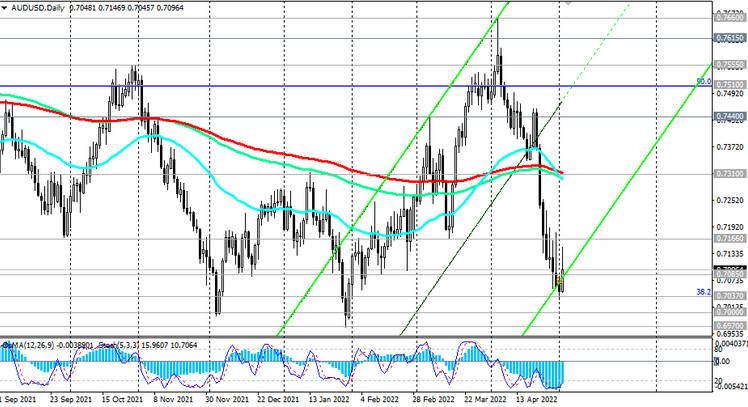
With the US dollar continuing to strengthen, the AUD/USD is likely to fall further. A signal to enter short positions can be a breakdown of yesterday's low and support level 0.7037 (Fibonacci 38.2% correction to the wave of the pair's decline from the level 0.9500 in July 2014 to the lows of 2020 near 0.5510) with the nearest targets 0.7000, 0.6970 (local minima).
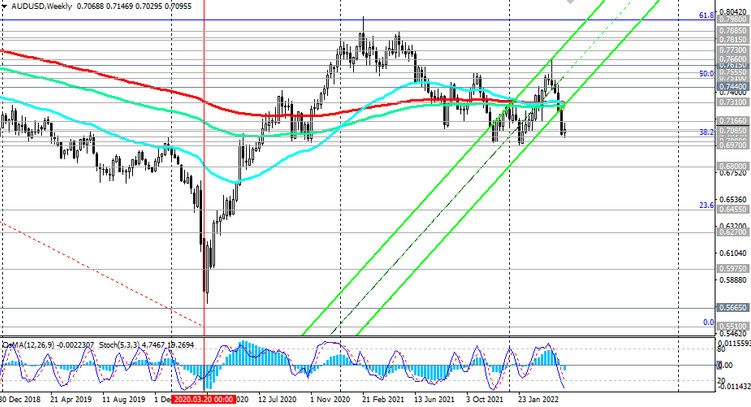
Breakdown of these support levels will strengthen the negative dynamics of AUD/USD and direct it towards the support levels 0.6800, 0.6455 (23.6% Fibonacci level).
In the alternative scenario, a break into the zone above the important short-term resistance level 0.7166 (EMA200 on the 1-hour chart) will be a signal to open long positions.
Growth above the resistance level 0.7310 (EMA200 on the daily and weekly charts) will indicate the return of AUD/USD into the bull market zone.
Support levels: 0.7085, 0.7037, 0.7000, 0.6970, 0.6800, 0.6455
Resistance levels: 0.7166, 0.7200, 0.7310, 0.7400, 0.7440, 0.7510, 0.7555, 0.7615, 0.7660, 0.7730, 0.7815, 0.7835, 0.7885, 0.7900, 0.8000
Trading Recommendations
Sell Stop 0.7070. Stop Loss 0.7170. Take Profit 0.7037, 0.7000, 0.6970, 0.6800, 0.6455
Buy Stop 0.7170. Stop Loss 0.7070. Take-Profit 0.7200 0.7310 0.7400 0.7440 0.7510 0.7555 0.7615 0.7660 0.7730 0.7815 0.7835 0.7885 0.7900 0.8000