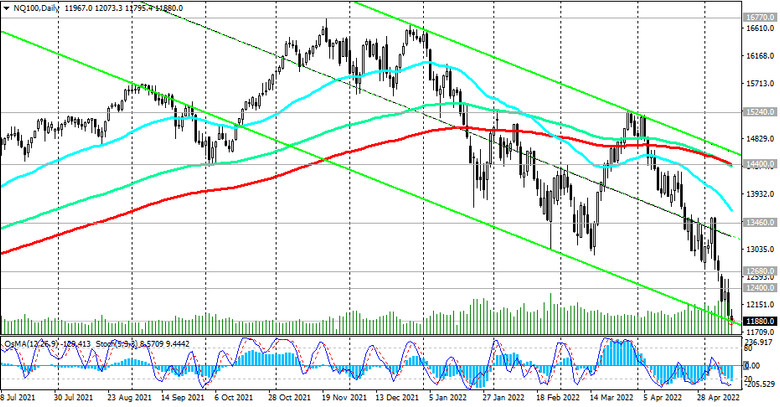
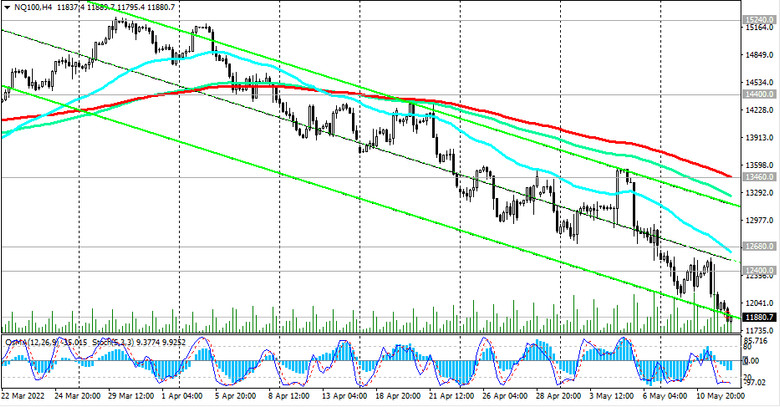
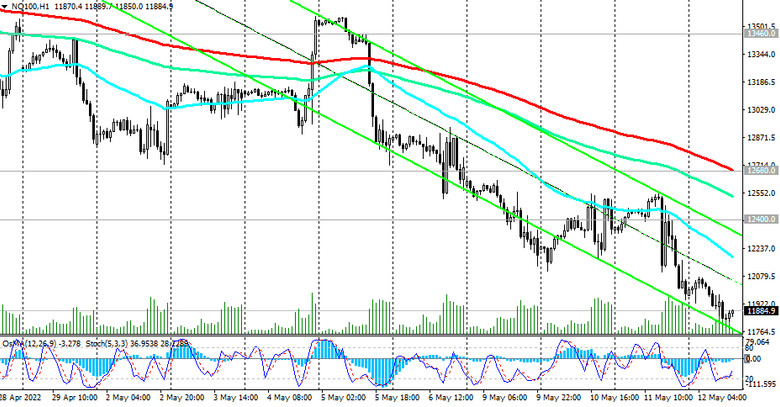
At the time of publication of this article, futures for the US stock index Nasdaq100 are traded near 11885.0, falling for the 6th week in a row.
On the weekly NQ100 chart, the price broke through the important support levels 12400.0 (EMA144), 12155.0 (the lower line of the descending channel). On the daily chart, the price is testing the lower line of the descending channel near 11890.0 for a breakdown.

The price is moving towards the key long-term support level of 11400.0 (EMA200 on the weekly chart of NQ100). A breakdown of the support level 11200.0 (EMA50 on the monthly chart) can significantly increase the risks of breaking the global long-term bullish trend NQ100.

So far, negative dynamics prevail and another strong negative impulse may lead to the implementation of this scenario.
In an alternative scenario, the downward correction in the US stock market will end near the current marks. The signal for resuming long positions NQ100 in this case will be a breakdown of the resistance levels 12400.0 and 12680.0 (EMA200 on the 1-hour chart).

The breakdown of the resistance level 13460.0 (EMA200 on the 4-hour chart) will be a confirmation signal in this case.
Support levels: 11400.0, 11200.0, 11000.0
Resistance levels: 12000.0, 12400.0, 12680.0, 13000.0, 13460.0, 14000.0, 14400.0, 15240.0
Trading recommendations
Sell Stop 11750.0. Stop Loss 12100.0. Targets 11400.0, 11200.0, 11000.0
Buy Stop 12100.0. Stop Loss 11750.0. Targets 12400.0, 12680.0, 13000.0, 13460.0, 14000.0, 14400.0, 15240.0


