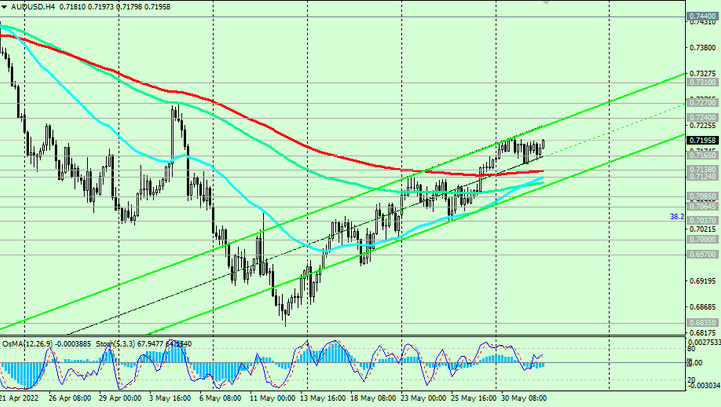
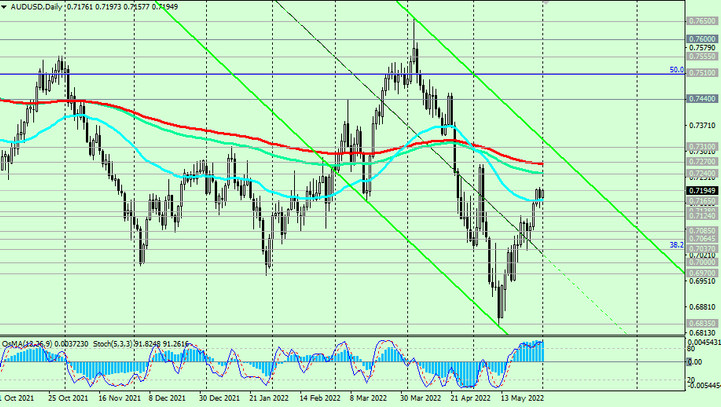
As we noted above, “at the time of publication of this article, the AUD/USD pair is traded near 0.7195 mark, maintaining positive dynamics (within an upward correction) above important short-term support levels 0.7138 (EMA200 on the 4-hour chart), 0.7124 (EMA200 on the hourly chart)".

AUD/USD maintains positive momentum, tending towards the key resistance levels 0.7240 (EMA144 on the daily chart, 0.7270 (EMA200 on the daily chart).

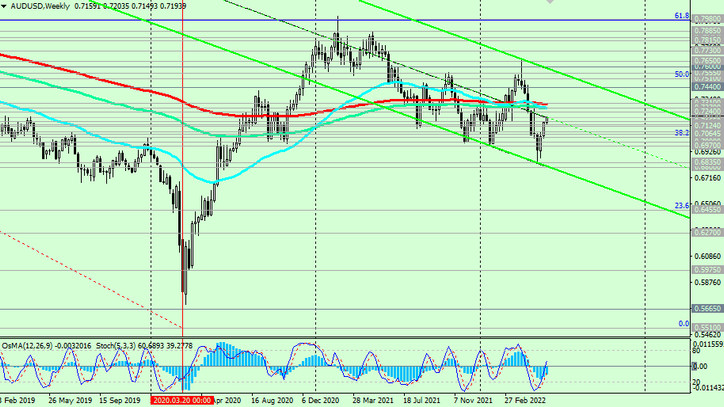
Further growth and breakout of the key resistance level 0.7310 (EMA200 on the weekly chart, EMA50 on the monthly chart) creates prerequisites for growth to the long-term resistance level 0.7600 (EMA200 on the monthly chart), which separates the long-term bull market from the bear market.

However, the breakdown of the important support level 0.7165 (EMA50 on the daily chart) will be the first signal to resume short positions.
In this case, AUD/USD will head deeper into the descending channels on the daily and weekly charts, the lower limit of which is near the 0.6800 mark.
Support levels: 0.7165, 0.7138, 0.7124, 0.7085, 0.7064, 0.7037, 0.7000, 0.6970, 0.6800, 0.6450
Resistance levels: 0.7200, 0.7240, 0.7270, 0.7310, 0.7400, 0.7440, 0.7510, 0.7555, 0.7600, 0.7650
Trading Recommendations
Sell Stop 0.7145. Stop Loss 0.7210. Take-Profit 0.7138, 0.7124, 0.7085, 0.7064, 0.7037, 0.7000, 0.6970, 0.6800, 0.6450
Buy Stop 0.7210. Stop Loss 0.7145. Take-Profit 0.7240, 0.7270, 0.7310, 0.7400, 0.7440, 0.7510, 0.7555, 0.7600, 0.7650


