
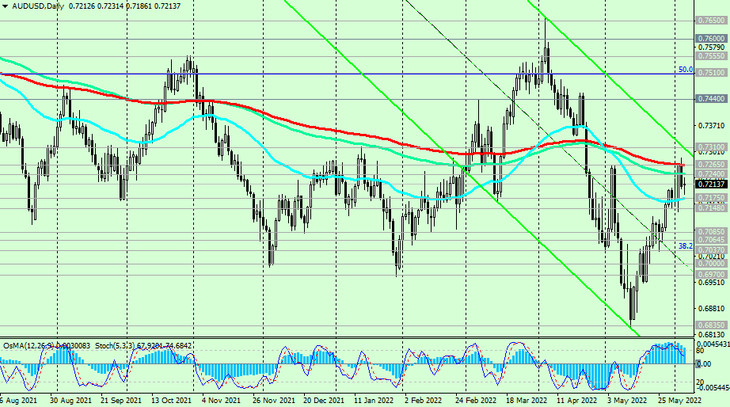
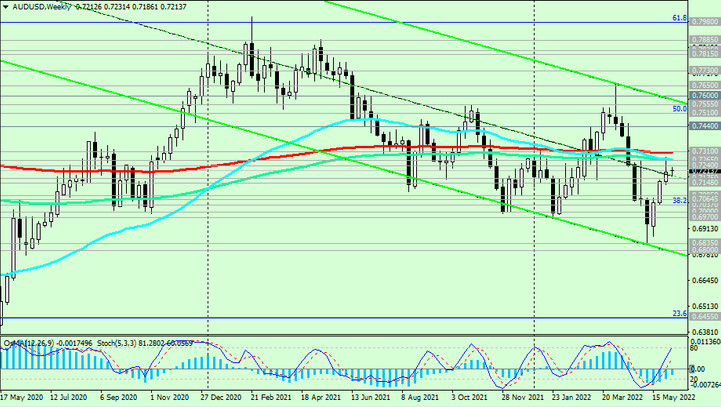
At the time of writing this article, AUD/USD is traded near 0.7215, moving in ascending channels on the 1-hour and 4-hour charts. At the same time, below the key resistance levels 0.7265 (EMA200 on the daily chart), 0.7310 (EMA200 on the weekly chart), AUD/USD remains in the zone of a long-term bearish market.
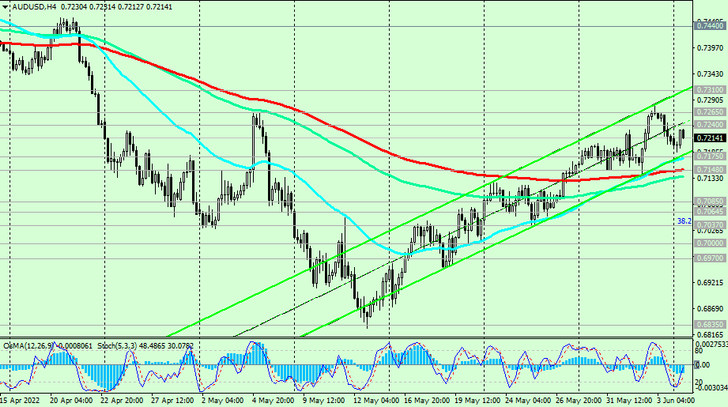
The signal for the resumption of short positions will be a breakdown of important support levels 0.7175 (EMA50 on the daily chart and EMA200 on the 1-hour chart), 0.7148 (EMA200 on the 4-hour chart).
In an alternative scenario, a break of the key resistance level 0.7265 will become a signal to increase long positions, and a break of the resistance level 0.7310 (EMA200 on the weekly chart) creates prerequisites for growth to the long-term resistance level 0.7600 (EMA200 on the monthly chart), which separates the global bull market from the bear market.
It is likely that tomorrow's RBA meeting will drive AUD/USD in one direction or another.
Support levels: 0.7175, 0.7148, 0.7085, 0.7064, 0.7037, 0.7000, 0.6970, 0.6835, 0.6800, 0.6450
Resistance levels: 0.7240, 0.7265, 0.7310, 0.7400, 0.7440, 0.7510, 0.7555, 0.7600, 0.7650
Trading Recommendations
Sell Stop 0.7170. Stop Loss 0.7250. Take-Profit 0.7148, 0.7085, 0.7064, 0.7037, 0.7000, 0.6970, 0.6835, 0.6800, 0.6450
Buy Stop 0.7250. Stop Loss 0.7170. Take-Profit 0.7265, 0.7310, 0.7400, 0.7440, 0.7510, 0.7555, 0.7600, 0.7650