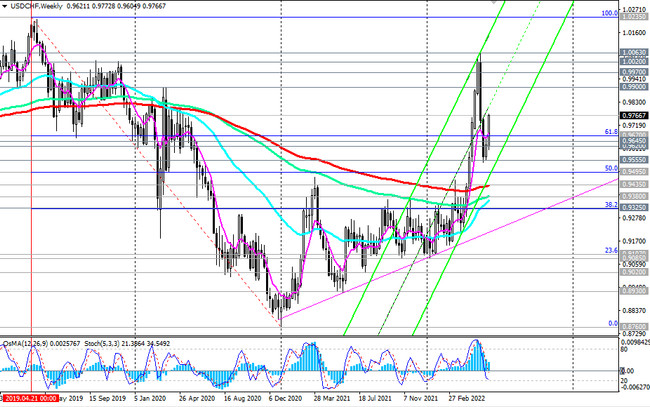
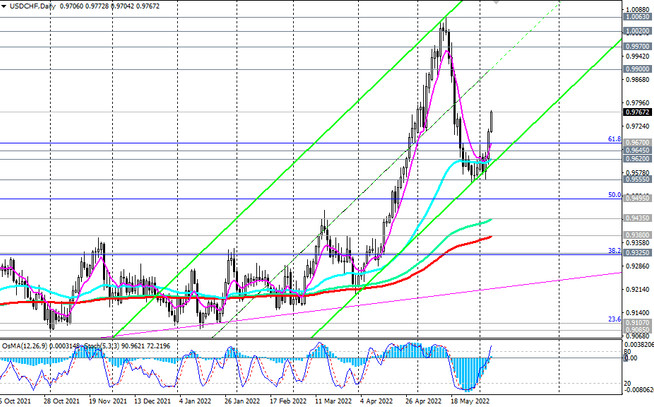
As we noted above, at the time of publication of this article, USD/CHF is traded near the 0.9766 mark. Today USD/CHF is growing for the 3rd day in a row, bouncing off the local 7-week low of 0.9544, reached on May 27.

The price maintains positive dynamics, and in case of breakdown of today's intraday and 3-week high of 0.9772 USD/CHF, it will continue to grow with targets at the resistance levels 0.9900, 0.9970 (EMA144 on the monthly chart), 1.0020, 1.0060 (local highs).

In an alternative scenario, the downward correction may resume after the breakdown of today's low 0.9705 and continue up to the support levels 0.9435 (EMA200 on the weekly chart and EMA144 on the daily chart).
A breakdown of support levels 0.9380 (EMA200 on the daily chart), 0.9325 (Fibonacci 38.2% of the upward correction to the downward wave that began in April 2019 near 1.0235) may once again push USD/CHF into the bear market zone.
Support levels: 0.9700, 0.9670, 0.9645, 0.9620, 0.9555, 0.9500, 0.9495, 0.9435, 0.9380, 0.9325
Resistance levels: 0.9780, 0.9900, 0.9970, 1.0000, 1.0020, 1.0060
Trading recommendations
Sell Stop 0.9690. Stop Loss 0.9740. Take-Profit 0.9670, 0.9645, 0.9620, 0.9555, 0.9500, 0.9495, 0.9435, 0.9380, 0.9325
Buy Stop 0.9785. Stop Loss 0.9690. Take-Profit 0.9900, 0.9970, 1.0000, 1.0020, 1.0060


