
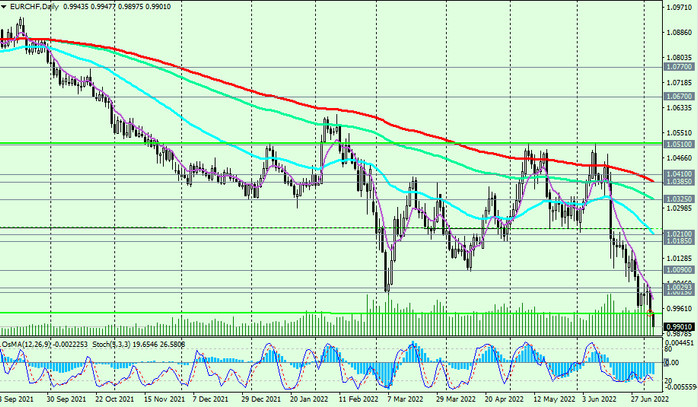
The EUR/CHF dynamics is dominated by bearish momentum and the pair continues to fall deeper into the descending channel on the weekly chart. Its lower border is close to 0.9800. It is likely to become an immediate target if the EUR/CHF decline continues.
As we noted above, the decline in EUR/CHF may continue until the price “gropes” for new support levels, and there are none yet.
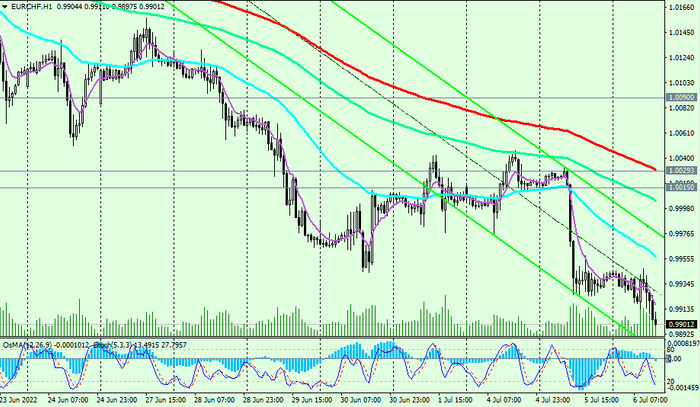
In an alternative scenario, and after the breakdown of the local resistance level 0.9948, corrective growth will continue towards the short-term resistance level 1.0029 (EMA200 on the 1-hour chart), the breakdown of which, in turn, will become a signal for the resumption of long positions.
For now, short positions remain preferable. Below the key resistance levels 1.0385 (EMA200 on the daily chart), 1.0410 (EMA50 and the upper line of the downward channel on the weekly chart), EUR/CHF remains in the zone of a long-term bear market.
Support levels:
Resistance levels: 1.0015, 1.0029, 1.0090, 1.0185, 1.0210, 1.0325, 1.0385, 1.0400, 1.0410
Trading recommendations
Sell by market. Stop Loss 0.9955. Take Profit 0.9900, 0.9800, 0.9700, 0.9600
Buy Stop 0.9955. Stop Loss 0.9890. Take-Profit 1.0015, 1.0029, 1.0090, 1.0185, 1.0210, 1.0325, 1.0385, 1.0400, 1.0410