Examples of using technical analysis on the majors to spot opportunities in the crosses
In the previous article, we discussed how movements in major currency pairs directly affect the exchange rates of cross pairs.
Support and resistance on major pairs often are the reasons for tops and bottoms to be established on crosses as well.
Here, in this article, we expand the idea of analyzing the crosses through the majors and we take a look at some real world examples of how combined technical analysis on major pairs provided a clue for where a particular cross pair will be moving.
EURJPY case
Consider this recent example on the EURJPY pair and how EURUSD and USDJPY separately gave indications of a bullish move in EURJPY.
Specifically, we are interested in what happened on the 15th of June and after that in all three currency pairs (as marked with the vertical line on the charts).
Starting with the majors USDJPY and EURUSD, the first obvious thing we can notice is that USDJPY is range trading and EURUSD is already in a well-established uptrend.
By definition, this kind of situation (where one major pair is trending and another is ranging) suggests that we can short either of the two currencies in the ranging pair - in this case the USD and the JPY against the bullish currency in the trending pair - in this case, the Euro.
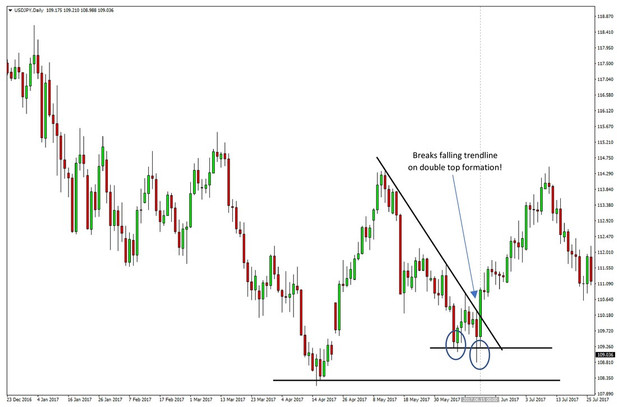
USDJPY completes a double bottom (in blue) - Daily chart
Now upon a closer look, we can see that the 15th of June was a Dollar-strength day with EURUSD falling and USDJPY rising on the day.
A look at the EURJPY pair on the same day, however, reveals that there is relative strength in the Euro over the Yen as EURJPY also ended the day higher – with no less but a bullish engulfing candlestick pattern at support.
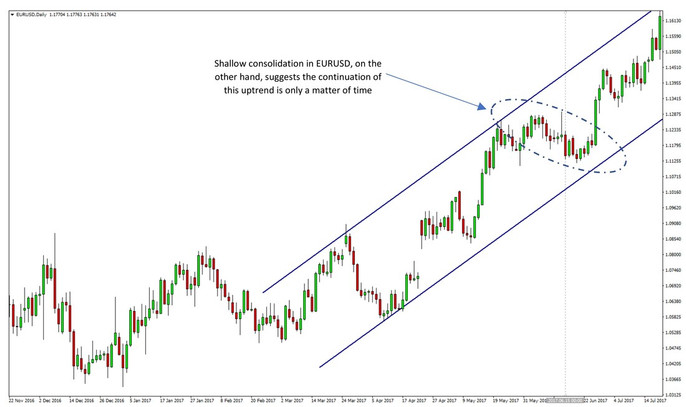
EURUSD in a powerful uptrend and the retracement is drifting toward support - Daily chart
USDJPY completed a double bottom with a huge bullish engulfing candlestick pattern while EURUSD also seemingly formed a top.
However, given the muscular uptrend in EURUSD, any bearish signal is to be viewed with extreme caution or completely disregarded.
When USDJPY and EURUSD are compared side by side USDJPY certainly looks like the better pair to be long on the USD rather than the EURUSD, simply because there is no trend working against such a trade.
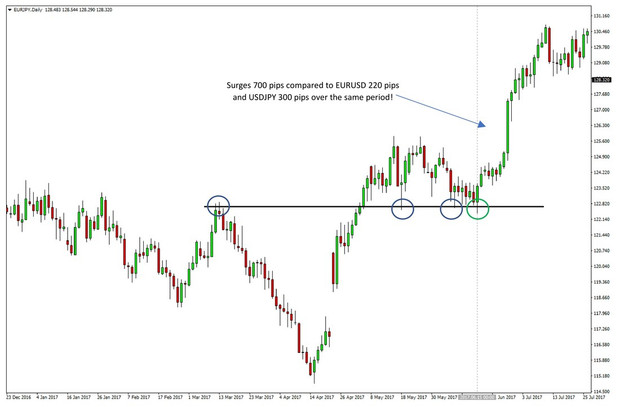
EURJPY bounces on support and surges higher – Daily chart
The implied strength of the Euro over the Yen favors a long EURJPY trade in this situation which would have been a very profitable thing to do.
Now, of course, we never know how things will unfold in the future but the well-established longer-term uptrend in EURUSD and a bullish pattern in USDJPY suggests being long EURJPY is a prudent position to take.
As is evident from the chart, both EURUSD and USDJPY continued higher taking EURJPY higher with them at an even faster pace!
GBPNZD example
Let’s now take a look at this GBPNZD situation and how we could have traded the GBPNZD pair by analyzing the technical situation on GBPUSD and NZDUSD separately and then combining them to get a better perspective for GBPNZD.
First, we can notice that on the GBPUSD currency pair, a downward trendline has been established as marked with the blue circles. Particularly interesting is the situation around the 19th of November (marked on the chart with the middle vertical line and red circle).
Here we can see that the GBPUSD pair is moving up toward the falling trendline to test it once more. A bearish engulfing candlestick pattern is formed and GBPUSD declines from the trendline to reach fresh multi-month lows.
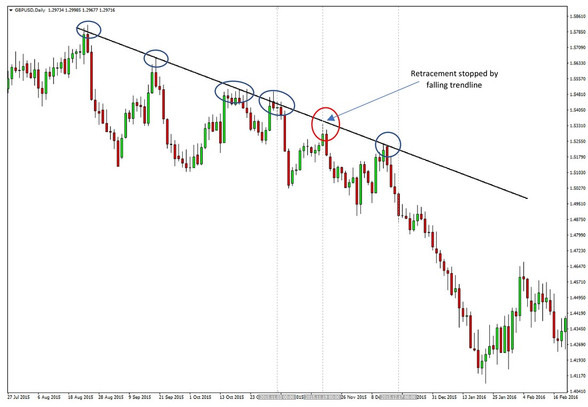
GBPUSD kissed the trendline (red circle) and slid lower – Daily chart
The situation gets particularly interesting for the GBPNZD pair when we also take a look at the NZDUSD chart. At the same time (November 19th), NZDUSD successfully tested and bounced from a support zone as shown on the chart.
The obvious conclusion from the GBPUSD and NZDUSD charts is that the technicals on GBPUSD look bearish while the price is at a key resistance area, and the technicals on NZDUSD look rather bullish while the pair is at a key technical support area.
These conclusions suggest that a key situation is also likely to unfold on the GBPNZD pair, favoring a bearish move since the GBPUSD picture is bearish and NZDUSD situation is bullish.
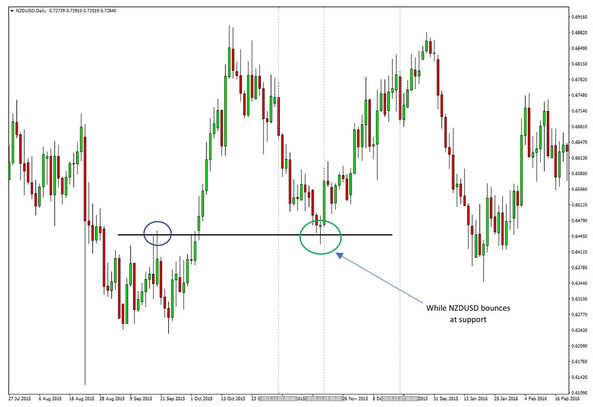
NZDUSD bounced from support (green circle) - Daily chart
The GBPNZD chart by itself, however, does not provide such insights as the GBPUSD and NZDUSD charts did separately.
Although there is a bearish engulfing candlestick pattern on the same day (19.11.2015), there is no significant support or resistance area nearby nor any particular bearish pattern on the chart.
This is exactly the kind of situations we referred to in the previous articles of this series where we noted that technical levels on cross currency pairs tend to be less reliable than on major pairs. These 3 charts show this phenomenon in action.
The significant situations on GBPUSD and NZDUSD provided an excellent trading opportunity on the GBPNZD pair that was not possible to spot if we had analyzed GBPNZD in isolation.
We can see that in the aftermath things progressed very well. GBPUSD fell after touching the trendline while NZDUSD continued higher after the bounce.
More importantly, this led to GBPNZD falling by more than 1000 pips in the period of November 19th to December 17th, 2015 compared to a 400 pips decline on GBPUSD and 130 pips rally in NZDUSD over the same period.
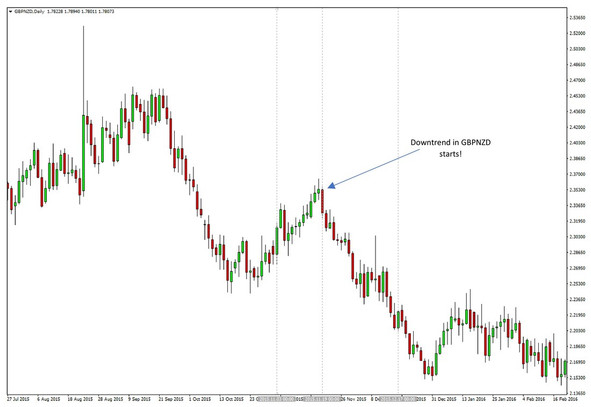
GBPNZD fell by over 1000 pips - Daily chart
Although the pair continued to decline further, Mid-December was a good time to close the short GBPNZD trade because NZDUSD was approaching resistance and GBPUSD was nearing a mild support level.
Finally, of course, this method of analyzing the majors to trade the crosses doesn’t always work perfectly and sometimes support and resistance will be completely blasted leading to a losing trade. However, being aware of the technical situation on major pairs is more beneficial than analyzing the crosses in isolation only.
Furthermore, an overlay of the fundamental situation for a given forex pair can provide even more confidence in taking a trade based on technical analysis compared to completely disregarding the fundamentals.


