Technical indicators are some of the primary tools traders regularly employ to get an edge in the market. These sometimes look complicated and very advanced but are, in fact, quite easy to navigate once you learn the basics. Technical indicators give you clear and straightforward signals about the market with specific price levels where an asset or currency pair may react or reverse in direction. Hence traders are fond of using them extensively, some even religiously following and analyzing each signal.
As you can probably imagine, the better your tools and the better you are at using them, the more profit you can make from the market. But getting the best indicators is not always easy for new traders. This depends on your broker and the trading platform they will provide you. That’s why it’s crucial that you check with your broker which indicators are available on their trading platform and the education resources they provide to their traders.
The top professional brokers provide the best trading resources and indicators. A quality broker should be able to offer you the tools that will help you be successful and also educate you on how to use those tools. Otherwise, it may as well be a casino and not a broker. So, if you want to see a list of the best Forex brokers around, take a look at this website.
The basic indicators profitable traders use
Most successful Fx traders will use at least one indicator of the three types that we discuss below. Many use more which helps them to confirm their setups and trigger price levels. Each indicator type plays a different role in the goal of assessing the market direction.
So, without any further ado, let’s see what they are and how you can use them.
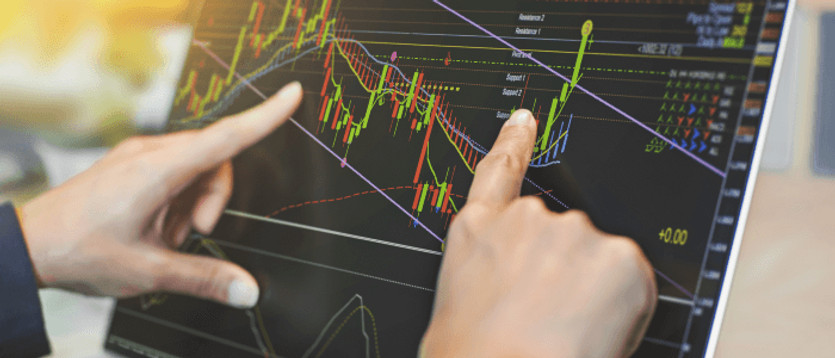
Trend indicators
Under this type, you will find moving averages, chart lines, and different oscillators like the ADX and MACD. These tools tell a trader what is the predominant market direction at the moment, or in case of a sideways market, that there is currently no trend in force.
Trend determining indicators are probably the most basic ones a trader needs; hence we have them first on the list. As you may have heard already, there is a saying that “the trend is your friend”. Whenever possible, you want to trade on the side of the trade, and these indicators help you do that.
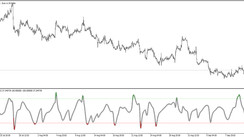
Momentum and overbought/oversold indicators
Momentum indicators help you understand the strength (or momentum) of a given trend. A stronger trend means that it is more likely to continue, and thus higher chances for a trend trading strategy to be successful in that case.
On the other hand, weakening momentum shows that the trend may be nearing its end. In this case, traders will be more cautious in expecting a further continuation of that trend.
The most commonly used indicators for this purpose are the RSI, Stochastic and the MACD. You may recognize the MACD from the previous section about trends. Yes, the MACD is a great tool that you can use to show you the trend direction as well as the momentum of that trend.
Volatility indicators
In this group, you will find indicators like the Bollinger Bands, Average True Range, Keltner Channel etc. These are also important as they can help you to understand how volatile a given asset or currency pair you can expect to be. This is important because it affects your risk management via your position sizing and placement of stop loss and TP levels.
For example, your stop loss will need to be wider on a more volatile currency pair compared to a pair with low volatility. If you trade them both with the same position size, then you will be risking more on the volatile pair because your stop loss is at a greater distance. So, in such cases, reducing the position size on the very volatile pair is the appropriate approach.
Extra indicators can give you a unique edge
Additionally, traders use some extra indicators that don’t fall into the three main categories discussed above but are very useful for analyzing the market. Your broker should be able to provide unique and smart indicators that will help you with your trading decisions.
An example of such an indicator is the market profile indicator. While it identifies similar price zones as classical support/resistance, the market profile is different because it analyzes the specific price structures over a certain period in the past.
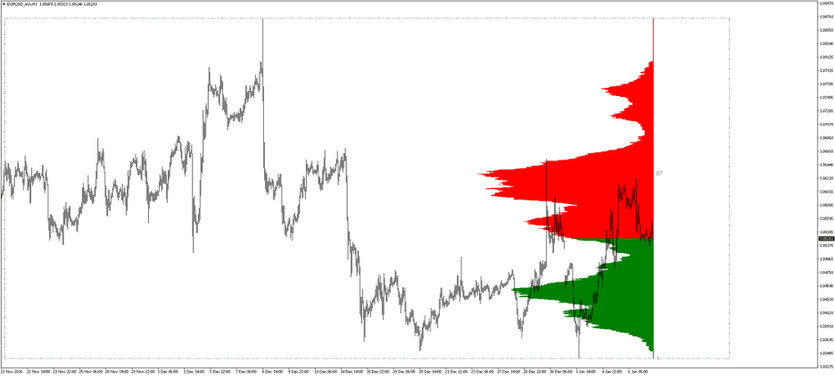
The price levels that are traded repeatedly and where the market gets rejected multiple times tend to be important because this is a place on the chart where the market is likely to react again in the future.
For example, EURUSD may trade to a high of 1.10 on the daily chart and quickly reverse down. This level would then be considered technical resistance. However, since the move and reversal were brief (lasting only a short time), the market profile indicator would identify this and would give less importance to this price zone compared to a price zone where the price stayed for a prolonged time.