After we laid out the basics of the Elliott Wave Principle we’ll now go into a more detailed examination of the different variations of the impulsive and the corrective waves.
Primarily, it’s important to see how to differentiate trends from corrections, what are the main characteristics of trends and what defines corrections, as well as types of impulsive (trending) and corrective waves.
Impulsive Waves
Impulsive waves are always in the direction of the predominant trend and they will always subdivide in the 5–wave structure. Any of the 3 impulsive waves can be the longest but wave 3 can not be the shortest wave. Usually, however, wave 3 is the longest and most powerful wave of the 3.
Wave 3 must surpass the end point of wave 1 and wave 5 must exceed the end point of wave 3.
An important clue of an impulsive wave being underway is a correct 5-wave structure accompanied by thrusting price action – usually visible on lower timeframes.
A common situation of a counting mistake is shown in the illustration below. The count on the left is wrong because one of the 3 cardinal rules of the Elliott Wave Principle is broken – wave 4 retraces below the endpoint of wave 1.
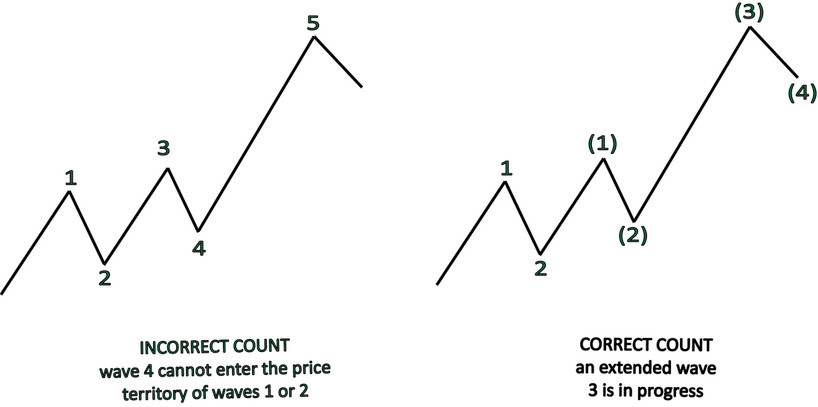
The count on the right is a case of a common occurrence where one of the 3 impulsive waves within the 5-wave structure is extended.
An extended impulsive wave is a wave that subdivides in a 5-wave structure of the same degree. When we look at the 5-wave structure as a whole it looks like a total of 9 waves because of the extension.
Usually, one of the waves within the 5-wave structure is extended and most often wave 3 or wave 5 will be the extended wave. Only one of the waves can be extended including an extension within an extension, which is also a common occurrence.
This simply means that 13 waves are the same as 9 waves which are the same as 5 waves. They are all impulsive of nature and part of an impulsive wave of a larger degree. Extensions should not be confused with the normal subdivision of the waves into waves of smaller degree, but rather an extension is a subdivision of a wave into waves of the same degree – thus we use the term extension.
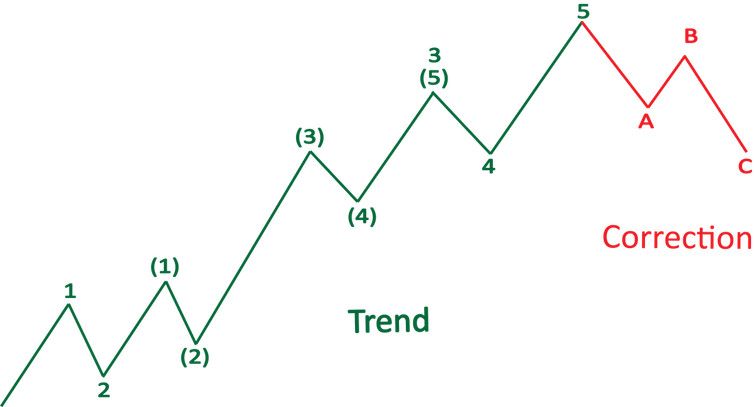
An extended 3rd wave within the 5 – wave structure resulting in a 9 wave total count
Corrections
Now let’s look at the types of corrections that can exist within an Elliott wave structure. The primary sign that the market is in a correction is choppy and overlapping price action. A lack of thrusting price action – a lack of the impulsive 3 wave structure is a clear sign that the market is in a corrective phase.
Although the Zig-Zag often does have sharp 5-wave structures in waves A and C, the Zig-Zag most often doesn’t appear alone and thus the net result is still an overlapping – corrective price action. This is shown later in this article in the wave X section.
Sharp Correction: Zig-Zag
Zig-Zags are the simplest type of correction. Waves A and C are impulsive in nature while wave B is constructed of a corrective 3 wave structure. The Zig-Zag correction can often be deep and violent and most commonly occurs during the early stages of the trend as a wave 2 correction of wave 1.
So far in our examples, we used the Zig-Zag correction to demonstrate the basic Elliott Wave structure, however, the Zig-Zag isn’t necessarily the most common correction and it certainly more often appears as a double Zig-Zag or a combination with some of the other corrective patterns.
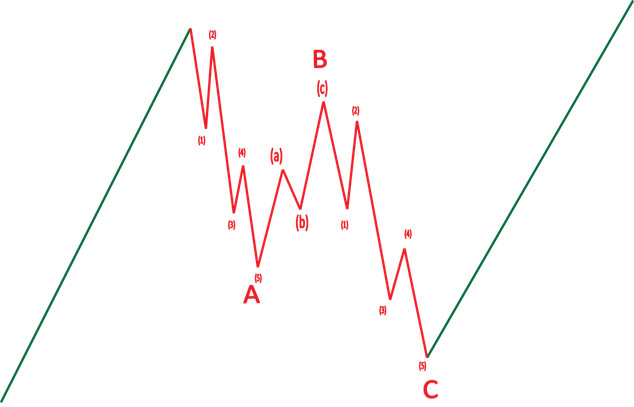
A sharp zig zag correction in an uptrend
Flat
A flat correction, like the Zig-Zag, consists of a 3 wave ABC structure, however, the key thing here is that wave A subdivides into a 3 wave structure and not in a 5 wave structure as in the Zig-Zag correction. This is the main difference between the Zig-Zag and the flat correction, in terms of counting them.
Regarding their characteristics, a flat correction is generally a sideways correction and is not a sharp correction like the Zig-Zag. It will, therefore, most often appear as wave 4 within the 5 wave structure.
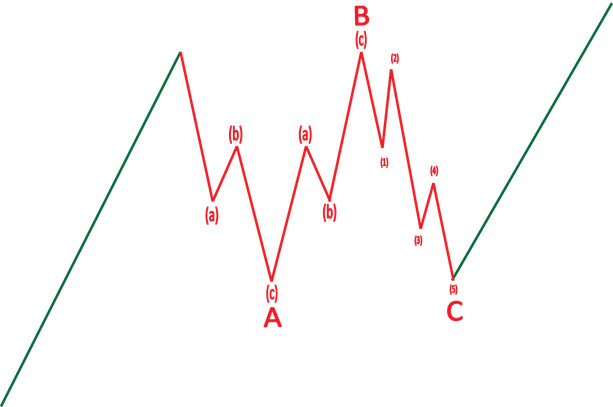
The flat correction within an uptrend
Triangle
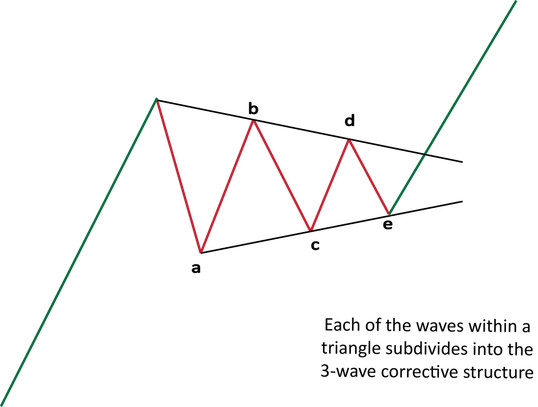
Each wave within a triangle subdivides into a 3-wave structure and none of the waves ever subdivides into the impulsive 5 wave structure.
The price action in a triangle should always be converging as is the case of the classical triangle in the technical analysis field.
So, according to the Elliot Wave Principle, trendlines can be drawn by connecting the endpoints of waves B and D, and the end-points of waves A and C. These two trendlines must be converging into each other either by going in opposite directions or one of them being horizontal.
Wave E in the triangle can end anywhere as long as it doesn’t surpass the end-point of wave C.
The main message from a triangle is that the next move in the direction of the trend is probably the last. This is especially true when the triangle appears alone in the correction (without any wave X combinations).
Most commonly a triangle will appear as wave 4 within the 5-wave structure. A triangle forming as a wave B within the ABC correction is also quite common.
Wave X
Wave X can be any 3-wave structure that appears during a correction and is in the direction of the predominant trend.
Wave X by itself is not a correction but it can appear within any of the correction types we discussed above. A wave X simply implies that the correction is not finished yet and will instead combine and prolong in time.
So, practically this means that when an X wave appears after a Zig-Zag and is followed by another Zig-Zag the pattern becomes a combined Double Zig Zag pattern. Wave X can also combine two or three types of corrections, so, for example, a Zig-Zag followed by wave X followed by a flat or a triangle will result in a very lengthy and complex correction.
There are no limitations to the number of combinations and the complexity of the corrections that can occur like this. That’s why it’s always strongly advised to trade only in the direction of the predominant trend and in the direction the impulsive structures.
Corrections are highly unpredictable by nature and the Elliott Wave Principle helps us to identify them so that we can avoid them and with that protect our capital. We can later use that capital in a smarter way by trading high-probability patterns like some of the impulsive structures we discussed here.
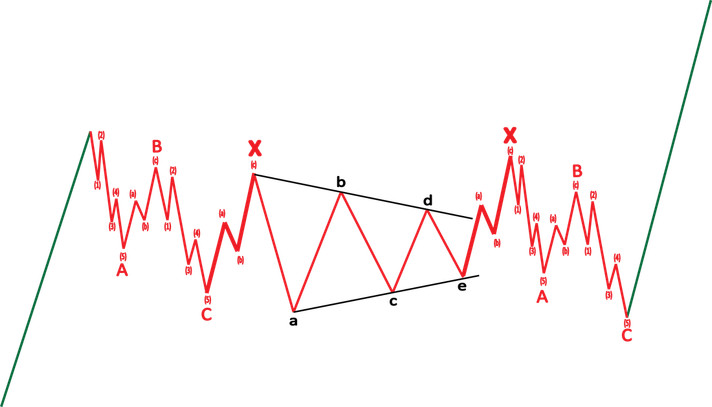
An example of an extended and complex correction in an uptrend - A Zig-Zag is followed by an X wave followed by a triangle, then another X wave and the correction finally ends with another Zig-Zag


