The Elliott Wave Principle is a strictly defined technical analysis method that uses definite price structures to get in tune with the current sentiment in the market and forecast future price direction.
Discovered by Ralph Nelson Elliott in the 1930s, the wave principle is one of the most popular technical trading strategies among traders.
Its core states that market trends develop, last and end in a very orderly and predictable manner, rather than being chaotic and random as it was believed by many at the time and is still believed by some today.
In his analysis spanning through the 1920s and 1930s, analyzing decades of past price data from the stock market, Elliott concluded that trends in the market move in a 5 wave structure followed by a 3 wave correction - counter the direction of the trend.
According to Elliott, the price waves are produced by natural shifts in human psychology from positive to negative and vice versa.
It is a common belief among Elliott Wave theoreticians that during times of strong bull markets the positive mood manifests in many forms of our lives like through more happy music being released, cheerful art, more comic books, movies, tv shows and so on. While in times of bear markets art gets darker, movies get creepier, more depressive music is released and pretty much the negative mood takes over on many levels in the social and cultural life as a natural part of a cycle.
Finally, after some time, the positive mood slowly returns and takes over again, after which markets turn and start moving up again in the same 5 wave structure.
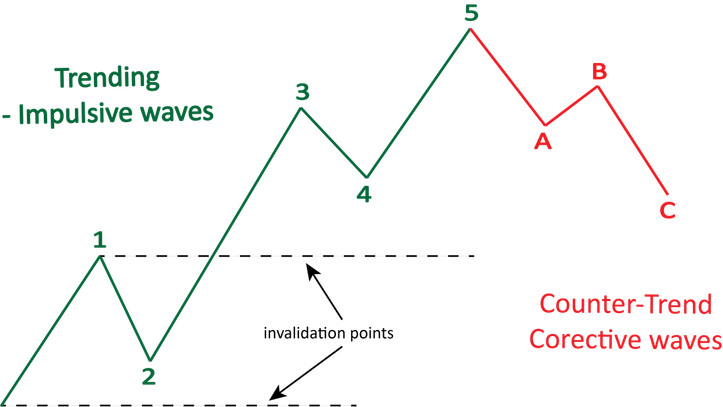
The basic count of the Elliott Wave Principle in an uptrend – Waves are labeled at their ending points
In Elliott Wave Analysis the waves moving in the direction of the trend are known as impulsive or motive waves and are labeled 1, 3 and 5 while the counter-trend waves are known as corrective waves and are labeled 2 and 4 within the 5 wave structure.
Wave 1, 2, 3, 4 and 5 (green on the charts) collectively are part of a larger trend and are followed by a larger 3 wave correction labeled as A, B, and C (red on the charts).
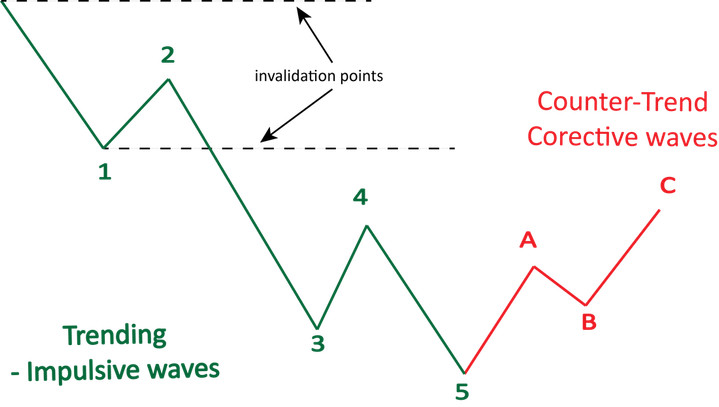
The basic count of the Elliott Wave Principle in a downtrend
Organic and Fractal Structure:
Elliott found that the structures tend to repeat across all timeframes and across all markets. He suggested that each of the waves within a trend is organic and fractal - constructed of the same wave structures of a smaller scale and is itself part of an overall larger trend.
Each of the impulsive waves is made up a 5 wave structure of a smaller degree and similarly, each of the corrective waves is made up of the 3 wave structure of a smaller degree. Within the large corrective A – B – C count, wave A and C are considered to be impulsive waves within the correction and are made up of a 5 wave structure while wave B is a corrective wave of wave A, inside of the correction.
Sounds confusing?
Because a picture is worth a thousand words and to understand this concept better, take a look at the following charts showing the fractal nature of market trends with the respective labelings.
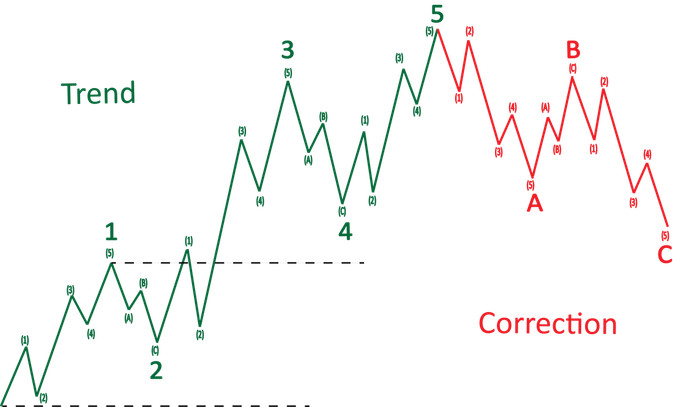
The organic nature of Elliott waves – Each wave consists of the same structures of smaller degree
Likewise, Elliott suggested that each 5 wave structure in the market is part of a trend on a larger timescale. To get a time length perspective, a 5 wave structure that lasts for 1 year, will be a part of a larger trend that may last for 5 - 10 years.
In the same manner, each wave in that 5 wave structure is made up of smaller 5 wave impulsive - followed by 3 wave corrective structures that may each last for 1 – 2 months. Elliott suggested that this goes on from the smallest scale of trends like on the 1-minute timeframe to the multi-decade trends in the market that can last for hundreds of years.
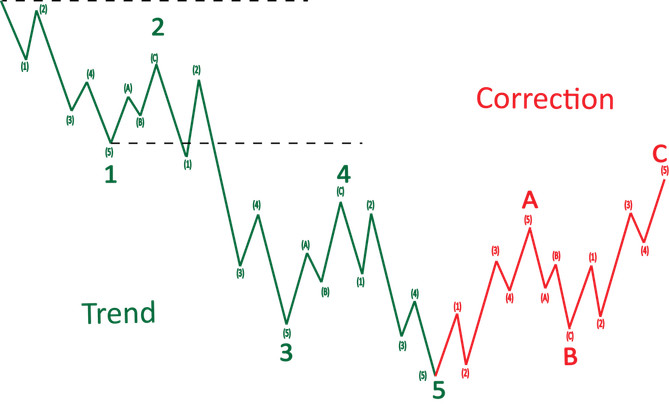
The fractal nature of Elliott waves in a downtrend – The waves of smaller scale are labeled with numbers and letters in parentheses
The 3 rules of the Elliott Wave Principle:
Finally, Elliott established the Wave Principle on 3 basic tenets that must hold true at all times in order for the analysis to be valid and to find the correct wave count at a given point in time. The first 2 of these rules are represented by the dotted lines in the charts shown earlier.
In case one of these rules is broken midway in your analysis it simply means that your analysis is incorrect and you should go back to the beginning of the count and start counting again to find the correct count in the structure.


