There are some forex traders who have mastered breakout trading and have reaped significant profits from doing so. Breakouts are fairly common in the FOREX and if you are able to accurately predict a breakout, you too can profit handsomely from trading them.
A breakout usually occurs at significant price levels such as classical support and resistance, important Fibonacci retracements/extensions, pivot points and so on.
Also, keep in mind that breakouts are most likely to occur following a period of consolidation after which the price suddenly either plummets or shoots up quickly, moving by several tens of pips in a matter of minutes.
How to Identify a Breakout
There are certain indications that you can look at to identify if a breakout is likely to occur or has occurred.
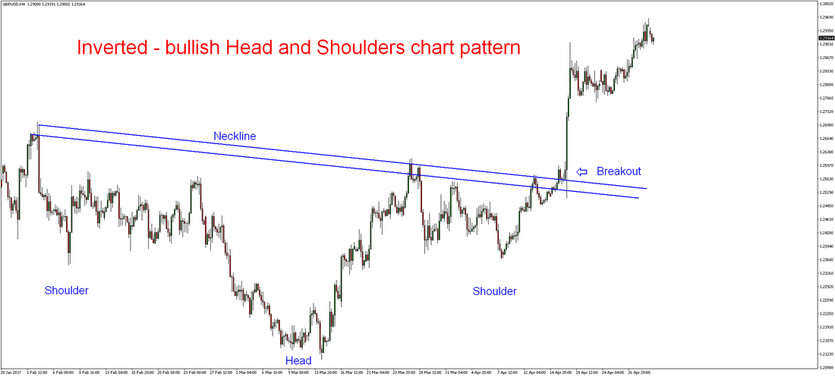
Chart patterns that may indicate a potential breakout include head and shoulders, double tops/bottoms, or triple tops/bottoms. Once you spot these patterns forming, you know that a breakout can potentially occur.
Essentially, a breakout occurs once some kind of a support or resistance level is broken. This level may or may not be tested several times previously. However, it’s important to note that the more times a particular technical level is tested but is not broken the stronger the inevitable breakout will be.
The neckline acts as the ultimate level to be broken in the case of the head and shoulders pattern and the double top and bottom patterns.
A double top indicates the reversal of an uptrend while a double bottom indicates the reversal of a downtrend. Entries should be placed below the neckline with a double top and above the neckline in a double bottom.
An inverted bullish head and shoulder pattern is indicated by a bottom followed by a lower bottom which is followed by a higher bottom. To profit from this, traders would place an entry above the neckline and exit at a distance that approximates the distance between the lowest point of the head and the neckline. Vice versa applies for standard bearish head and shoulder pattern.

Range Breakouts
One of the more commonly traded types of breakouts are those that occur out of a tight range, known as the range breakout.
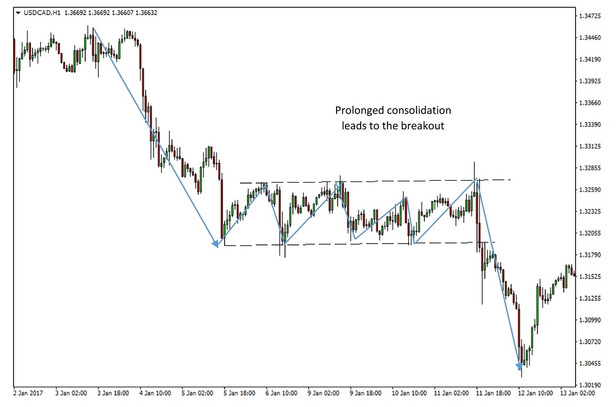
A range can be defined as a formation on the chart bounded by 2 horizontal lines between which price is stuck for a prolonged period of time. The prolonged period of consolidation inevitably leads to the ensuing breakout – giving traders excellent opportunities to profit.

USDCAD 1h chart - A range breakout in the direction of the prior trend
Range breakouts occur and can be traded on any chart, on any timeframe and in any financial market. In the Forex market, they tend to work particularly well, though by no means they are easy to trade. The trader still has to build enough experience and knowledge before he can repeatedly trade breakouts successfully in the long term.
The breakout of a range can either be in the direction of the previous trend or it can be a signal of a trend reversal and the beginning of a new trend.
Channel and Trendline Breakouts
Channel breakouts are another type of a breakout that is similar to trendline breakouts. In fact, a channel breakout consists of a trendline breakout.

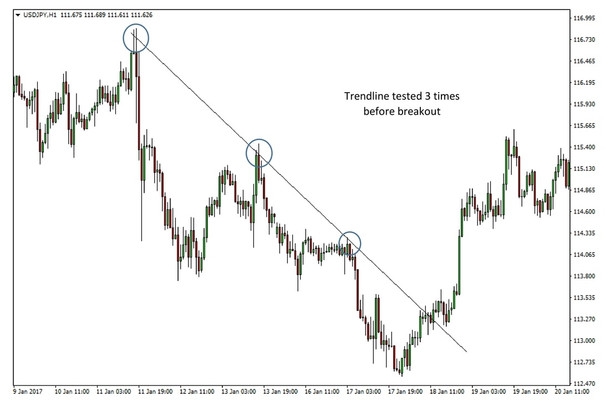
USDJPY 1 hour chart – The breakout of the resistance trendline signaled the reversal
As the name suggests, the channel breakout occurs when price either drops sharply or rallies quickly outside of a channel on the chart. This usually happens during periods of high volatility and is indicated by long candles that form outside of an established channel. Like the range breakout, channel breakouts can be traded on any timeframe. Entries should be placed right below or above the first breakout candle on the close.
Trendlines are similar to channels but instead of having an upper and a lower border, trendlines have only one border. Once the trendline is broken on the candle’s close, we say that a breakout of the trendline has occurred.
With trendline breakouts, it’s a good idea to use additional indicators to confirm the breakout like for example, the MACD indicator or momentum oscillator .


