Are you familiar with the Momentum Indicator? If you are trading for a while now, there is a huge chance that you already encounter this indicator in the MetaTrader 4 trading platform. But if you are a newbie in trading or just do not know how the indicator works, you may want to read this article because it will tackle about momentum indicator and the proper way of using it in forex trading.
Momentum Indicator's Definition and Calculation
First, let us define what the Momentum Indicator is.
Momentum Indicator is defined as a movement indicator that is created to identify the strength or speed of the price movement. It compares the most recent to a previous closing price on any time frame and is shown as a single line on its own specialized chart separating it from the price bars.
Similar with ATR indicator, momentum indicator can be calculated easily. Although traders are using several variations of Momentum Indicator, an universal calculation of the Momentum indicator can look as below:
M = (CP / CPn) * 100
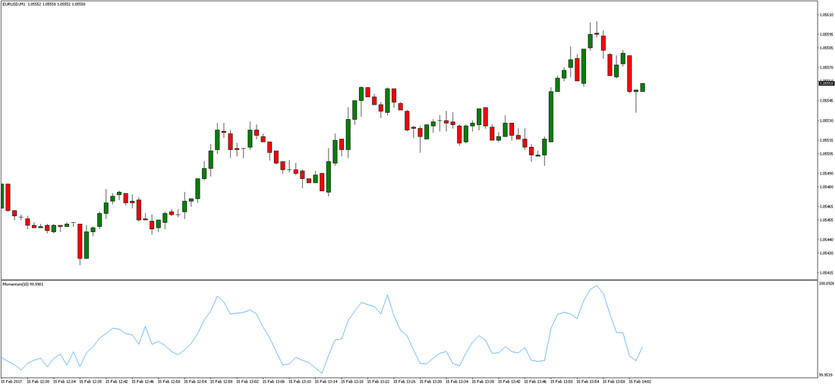
The Momentum indicator “M” is the ratio of the current Closing Price “CP” and Closing Price "n" Periods ago (“CPn”). In the picture below you can see the Momentum indicator with the Period variable set to “10”. So in short, the indicator judge against the current price to the price from 10 minutes ago (as the chart below is M1 time-frame).
How to trade with the Momentum Indicator?
As the momentum indicator determines whenever the price is moving downwards, upwards and by how much - you can use it as a trading signal or let it help you confirm trades base on the price action.
1) The 100 Line Cross:
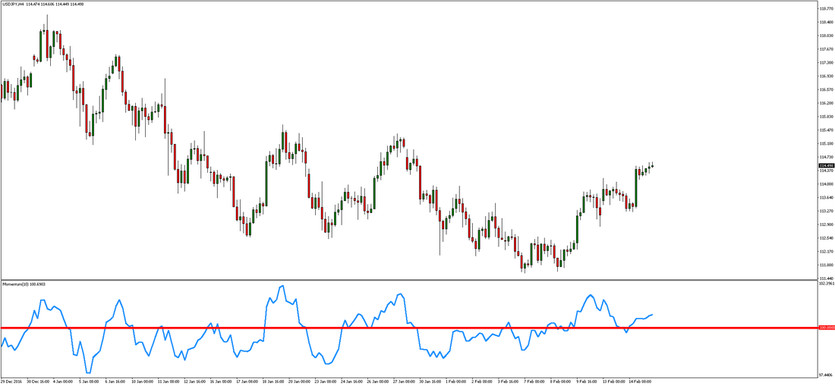
This is where the price crosses below or above the 100 signal line. It can be represented as a buy or sell signal. Whenever the price is above 100, it is a sign that the price is starting to move upwards, a drop below 100 shows that the price is dropping since it had moved below the price “n” periods ago.
While this signal can work nicely during strong trend moves, sideways moves usually lead to false signals.
2) The Moving Average (MA) Crossover:
As you buy and sell whenever the price crosses or drops below 100 often provides poor timing - this results in a lot of false signals during range moves. To solve this, you can try to add an additional moving average to the indicator. This means that a buy signal is generated when the momentum indicator crossed above the moving average from below and vice versa.
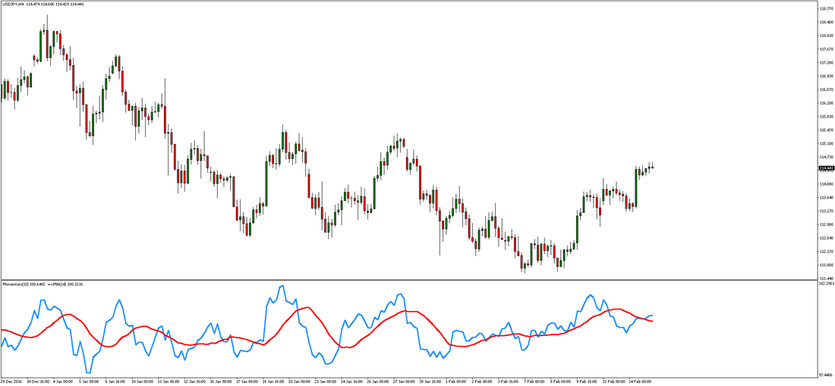
TIP for MT4 users: To add Moving Average to the Momentum indicator, simply go to the Navigator in the MT4, and drag the Moving Average indicator to the window of the Momentum indicator. Then in the new window - set "Apply to" variable to "First Indicator's Data".
3) The Divergence:
This is when the price is moving lower but the momentum indicator is moving higher. This is the so-called “bullish divergence”. It showcases the scenario that when the price is falling, the momentum following the selling is slowed down. If you get a “buy signal”, the divergence can help you determine if it’s true. Vice versa applies for the bearish divergence.
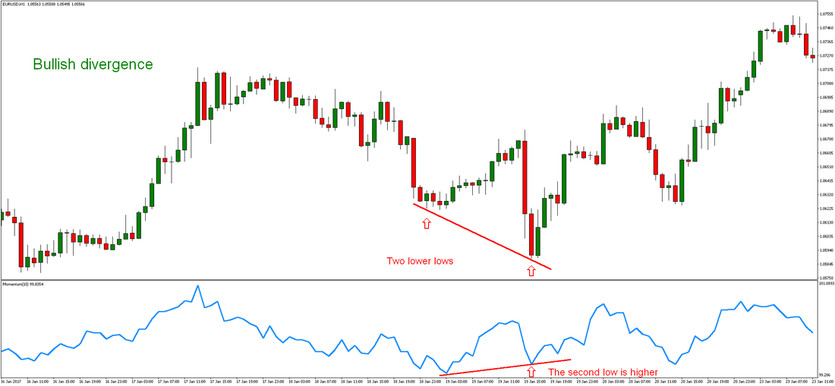
As you start using Momentum Indicator on your trades, you should keep in mind that it will not provide you with much information when a market is in the range period. But, it can help you to spot upcoming market lows and highs by using divergence signals.
Momentum Indicator is a very complex matter. It will probably take you some time to become really familiar about. You will also probably go through certain errors to get it right but once you master it, you can excessively use it as you trade.

