Pivot points can be used in many ways to determine turning points in the markets. In previous articles, we discussed the basics of Pivot Points, the calculation formulas for the different pivot point levels, and the 70 – 80 percent rule which can be very useful as an addition to any trading strategy.
Here in this article, we will see how we can use the different Pivot Point levels to find support and resistance where otherwise there wouldn’t be any and how to use the Pivot Point as a market sentiment indicator.
Gauging market sentiment with the Pivot Point
Let’s start with using the middle pivot point as an indicator of the current sentiment in the market.
In our previous article, we mentioned that we can use the middle Pivot Point as a seesaw of market sentiment. That is, we can gauge whether the market feels bullish or bearish at a given point in time and use that to determine the likely scenarios for how price moves could unfold.
In essence, gauging market sentiment with the Middle Pivot Point is very simple.
When the price is trading above the pivot point it means that the sentiment in the market is bullish and accordingly bullish positions should be favored. On the other hand, if the price is trading below the Middle Pivot Point then the sentiment is bearish and short positions would be more likely to be profitable.
However, it must be noted that this is not a rule that should be religiously followed to the letter, nor that the price will always continue to move higher if the sentiment is bullish or lower when the sentiment is bearish.
Far from it, in fact.
However, this indication of market sentiment can be valuable in certain situations and it’s best to be used as an addition to the overall and larger picture to confirm other signals and indicators. Just because the sentiment is bearish or bullish is not enough of a reason to enter a trade. Support/Resistance, other technical tools or fundamentals should be taken into account before taking a trade.
The chart below shows how the price is biased to move either toward the first pivot support (S1) or the first pivot resistance (R1) depending on which side of the middle pivot point it currently is.
Price respects the Pivot Points in most cases (Orange - Weekly Pivot Resistance 1, Blue - Weekly Middle Pivot Points, Green - Weekly Pivot Support 1) - EURUSD 1h chart
Support and resistance confluences
Determining key levels on the chart where the price can reverse is one important aspect where Pivot Points are also tremendously useful. And not just the Middle Pivot Point, but in fact, all of the 7 Pivot levels can be used very successfully and in the same manner for this purpose.
In the previous articles, we said that pivot point levels work in the same way as classical horizontal support and resistance levels. That is to say, when the price reaches them in most cases it will at least stop for a while or even reverse from them – just like it would react to a normal support or resistance level.
Like with the other signals from the Pivot Points indicator, it’s important to be aware of the larger picture and other important technical levels on the chart. Just because there is one sole pivot point support or resistance at a given level doesn’t mean the price will reverse immediately after reaching it. However, if that pivot point is in confluence with other technical signals pointing in the same direction then we have a winning combination.
Combine Pivot Points of different scale
One of the best ways to use pivot points is to combine the levels from the weekly, monthly and daily pivot points. In this way, any pivot point level (be it daily, weekly or monthly) is strengthened when another pivot point from a different scale is found in the same area on the chart.
It’s amazing how much more accurate trading with pivot points is in this way. Very often this kind of support or resistance confluence can be even stronger than the normal horizontal support/resistance we are used to.
We must keep one simple guideline in mind when combining pivot points of different scales:
Larger scale Pivot Point levels are more significant. That is the monthly Pivot Point will provide stronger support/resistance than the weekly and the weekly will be stronger than the daily.
Here’s a chart showing how a strong confluence of pivot points in the same area on the chart caused the price to stop and reverse.
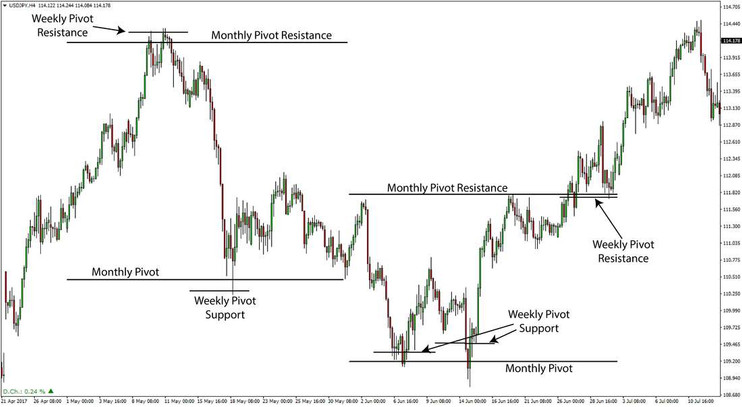
The monthly and weekly Pivot Point confluences (only partially shown here for viewing clarity) accurately pinpointed the tops and bottoms in terms of both time (when) and place (price levels) - USDJPY 4h char
Finding extreme levels for the current trading session (also known as overbought or oversold levels)
This is another area where Pivot Points are an excellent indicator.
Basically, the farther from the middle pivot point the price moves the more overbought (when it’s moving higher) or oversold (when it’s moving lower) it is.
One very useful guideline here is as follows:
If the price moves beyond the 3rd Pivot Resistance or 3rd Pivot Support level it is considered that the currency pair has reached extreme levels and it most probably will consolidate for the remainder of the session (doesn’t matter if it’s daily, weekly or monthly Pivot Points).
A move beyond the Third Pivot Point either up or down is a strong indication of stretched levels being reached and further moves only happen in extreme market conditions (e.g. Brexit or similar market crashes). In normal trading conditions, a move above the second Pivot Point already starts to show signs of overextended price levels and usually the market will consolidate for some time before continuing the trend.
This can be a very useful tool in many situations. For example, if you are looking to enter the market long during a bullish trend, but you notice that the price is already trading above the third pivot resistance, the better strategy here would be to wait for some time before entering.
Once the market has digested the big move and conditions are no longer overbought, then you can enter the trade– probably at a much better (lower) price.
Finally, here’s an example of how price stalled after reached overextended price levels according to the Pivot Points indicator.
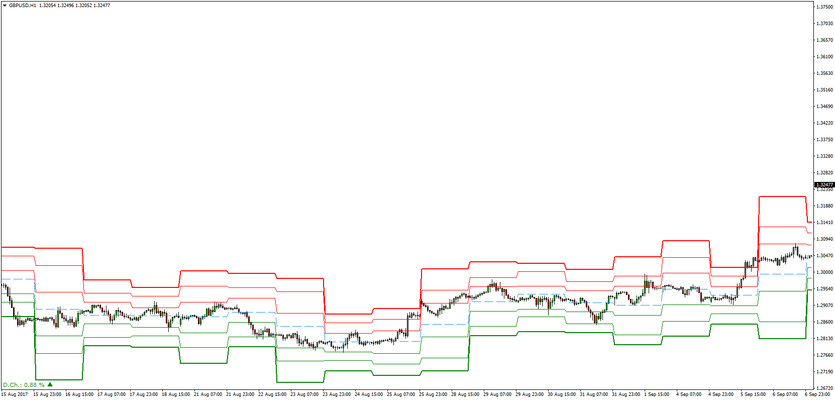
Price rarely moves outside of the pivot points range. And when it does it usually stops (Third Support and Resistance are shown in bold lines). - Daily Pivot Points shown on a 1 hour GBPUSD chart


