There are many technical indicators that are useful in trading the markets but if there is one indicator that stands out because of its high reliability and accuracy it would be pivot points.
This simple, yet very effective indicator works almost as precisely as a Swiss watch in that the specific probable outcomes for a given situation are materialized in most cases.
In this first article of the series on Pivot Points, we’ll discuss one of best ways to use them in your trading which is the 70-80% rule. In this introductory article here you can read about the basics of pivot points and how each of the Pivot Point levels is calculated, while in subsequent articles in this series, we’ll discuss some additional great ways in which Pivot Points can be used to gain an edge in the markets.
Briefly revisiting the basics of Pivot Points
Pivot points are actually nothing more than averages calculated based on different past prices from the underlying asset or currency pair. There are 7 price levels in total derived from the pivot point indicator – 3 support levels and 3 resistance levels (labeled 1, 2 and 3) plus the middle or main pivot point that acts as a seesaw for the market’s sentiment.
Pivot points can be calculated based on daily, weekly, monthly and even yearly periods.
Normally, for short-term trading, like day trading and scalping, a trader will use the daily pivot points. Medium term traders such as swing traders tend to focus on the weekly and monthly pivot points while extreme long term traders can even use the yearly pivot points alongside the monthly pivot points.
Being aware of higher scale pivot points will be beneficial to all trading strategies, whether short or long term. So, even if you are a day trader or a scalper, knowing where the weekly, monthly and yearly pivot points are on the chart is important because very often the market will stop or even reverse at these exact levels.
A very important point to take away from this is that the behavior of price in relation to the pivot points remains the same for all timeframes. Some of the strategies we will discuss here work proportionally the same on all timeframes on all pivot point periods which makes this indicator super easy to use.
The 70 – 80 percent rule
Now let’s get into the first strategy for using pivot points in Forex trading – the 70 – 80 percent rule.
This statistical rule says:
The middle pivot point (also known as the main pivot point) is reached by the price in 70 – 80 percent of the cases during the trading session.
That is, for daily pivot points about 70 – 80 percent of the time the middle pivot point will be reached at some point during the daily trading session. For the weekly pivot points, the middle pivot point will be reached at some point during the week in 70 – 80 percent of the cases etc... The same holds proportionally true for the monthly and the yearly pivot points.
Using the Middle Pivot Point in trading to time entries
Now the obvious question may be, ok that’s great, but how can we use this statistic to our advantage in trading?
There can be many creative ways in which one can profit from this information alone, but two very effective uses are for determining the best stop and entry levels.
Let’s first look at how one can get better entry levels using the middle pivot point.
Suppose that you want to enter in a trade, regardless of the currency pair of choice. You may be looking at any of the timeframes on that currency pair and looking to enter either short or long. The location of the pivot point on the chart for the given day, week or month is valuable information to be aware of nonetheless, simply because of the fact that there is a high probability that it will be reached.
Live examples of how the 70-80% rule can be used
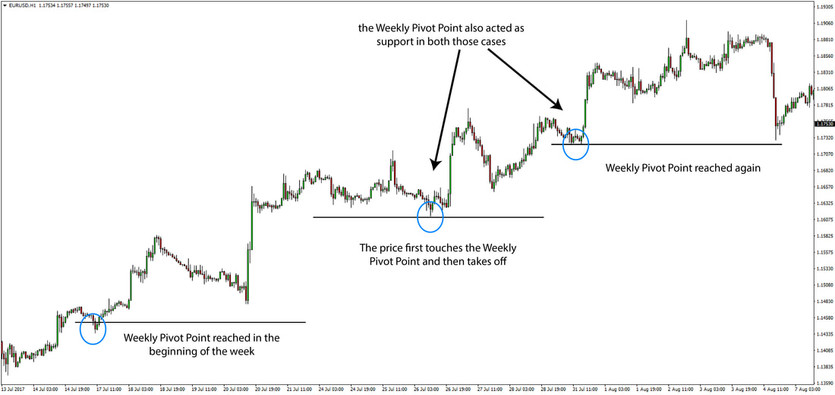
Let’s say you are looking to enter into a buy position on EURUSD, it’s the beginning of the week and the middle weekly pivot point is located below the current market levels. This kind of a situation is an excellent opportunity to get a much better entry price by waiting for the market to fall to the pivot point (remember there is a 70-80% probability that it will happen) before entering into the trade.
The pivot point can be 30, 50 or even 100 pips lower than the Monday opening levels, so knowing where the pivot points are is certainly very valuable information you want to be aware of, and it takes only a glance at the charts to obtain.
Here’s a real-world example of the EURUSD pair of how the market fell in the beginning of the week to touch the pivot line before taking off to the upside.
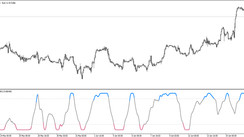
EURUSD 1h chart - The market will normally first touch the middle pivot point and then choose a direction
Using the Middle Pivot Point to place stops
Placing the stop below the pivot point (for long trades) and above it (for short positions) is another very reliable strategy to use pivot points.
The other 6 pivot levels (the 3 resistance and 3 support levels) can be used in this manner as well because the middle pivot point acts as support and resistance very often as is evident from the charts. Price most often stops at it, at least for a while or even completely reverses.
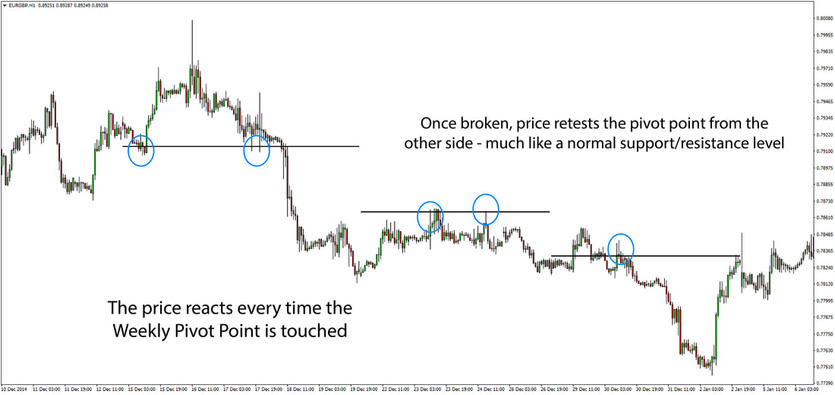
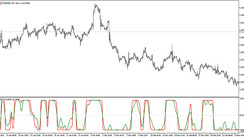
EURGBP 1h chart - Pivot Points are support and resistance
Watching how the price reacts to the pivot point can give clues on what happens next. For example, a bullish pattern at the pivot point would suggest that support will likely hold and we should take a long trade.
On the other hand, if the price goes through the pivot point and stays there then it means that the sentiment in the market has shifted from bearish to bullish or vice versa. In essence, it’s much like classical horizontal support and resistance.
In the next article of this series, we’ll get into more details on how to use all of the pivot point levels as support and resistance and also combine them with an overall well-balanced trading strategy.