There are many methods of technical analysis to trade the markets. However, only a few are worth spending the time on and even more so, betting your money on. Reading price action is a solid, practical method to trade financial markets.
The philosophy behind price action trading is simple. In fact, it’s way simpler than some of the other much more complicated and way less successful methods to analyze the market.
Here, we’ll look at 4 ways in which you can use price action reading to improve your forex trading results.
1. Support turning into resistance and vice versa
The good old support and resistance never go out of fashion. They are the bedrock of price action trading and to a high degree all technical analysis in general.
Very important concept is resistance turning into support during an uptrend (as on the example shown below) and support turning into resistance in a downtrend.
Take a look at this trend on the chart below. The swing highs are purposefully marked with horizontal lines so you can easily see how well this concept works. Notice how almost each small swing high in the uptrend was then retested from the other side and it provided support for the next leg up. These were all good entry points to join this uptrend.
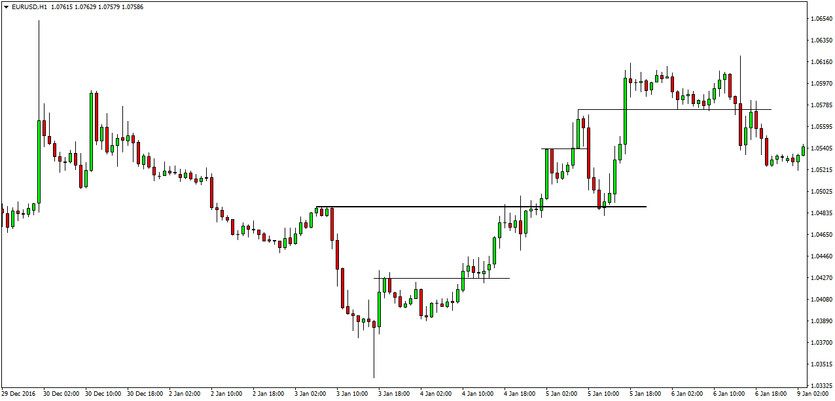
EURUSD 1h chart – resistance frequently becomes support
And it works exactly the same in a downtrend, with the only difference that swing lows (originally support) turn into resistance.
2. Know the candlesticks
If you are going to trade based on price action then there is no better way to do so than by reading pure candlestick formations.
Many combinations and patterns can be formed on a candlestick chart that will be profitable most of the time, but what’s also important is to go a little deeper and pay attention to every single candle line and how the bodies and the shadows are related to each other.
Some basic rules on candles:
- Tall bodies indicate strength of the move (trend)
- High wave candles (Long upper and low shadows) - indicate indecision
- A long shadow on one side of the candle indicates rejection of price (reversal)
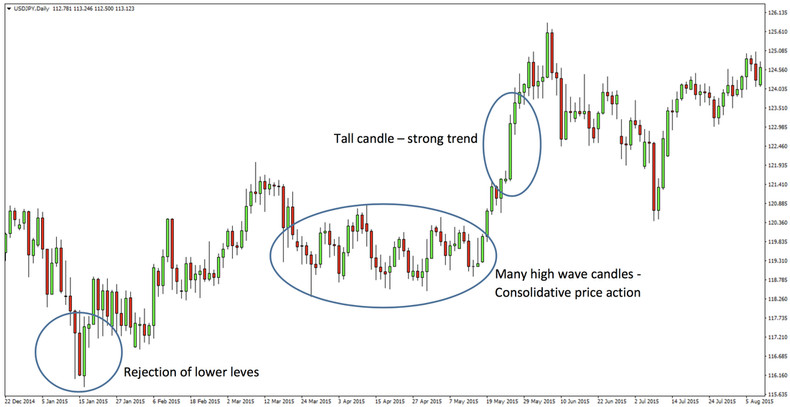
USDJPY chart - Reading candles
TIP: You can explore more information about trading the Candlestick patterns in our educational article.
3. Be aware of the market environment before you take a trade
Any trading signal you get is worthless if it doesn’t appear in the right market environment. For example, let’s say you find that candlestick reversal patterns work really well for you.
Well, if some candlestick pattern appears in the middle of the chart far away from any meaningful price level, like for example a support or resistance zone, then that candlestick pattern is much less likely to give you a profitable trade and should not even be considered as a signal to take a trade.
Being aware of the market environment is very important, often times even more important that reading the actual patterns and signals.
Here’s an example of a reversal pattern that didn’t work so well because the context in which it appeared didn’t match the signal of the pattern.
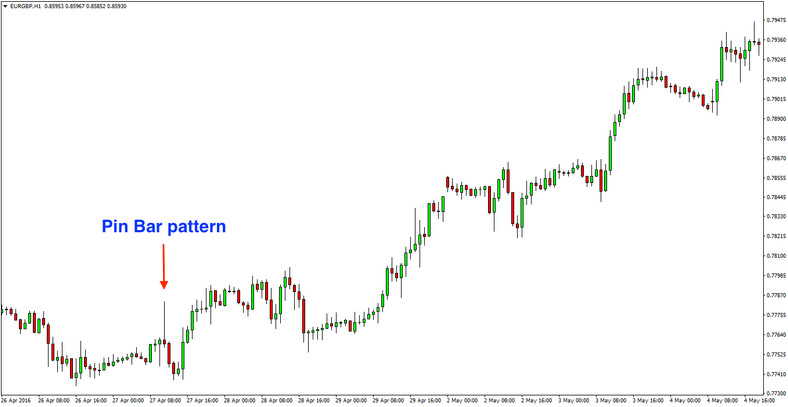
The importance of the market environment - this sharp move down turned out to be just a retracement.
Some more important market environments to be aware of are:
- trending
- consolidating (not trending)
- support/resistance is near or far
- trading in some kind of a formation (like a box range, triangle, wedge, etc.)
4. Know the difference between an impulsive and a corrective market swing
Each swing in the market is either a corrective or an impulsive one. There is no third option.
Being able to properly read the price action inside each market swing will give you the ability to know in advance whether or not you want to enter the market in a particular direction.
Now we are going to first look at this naked chart and then we will draw some lines to show you how you could have picked the reversals in both directions here.
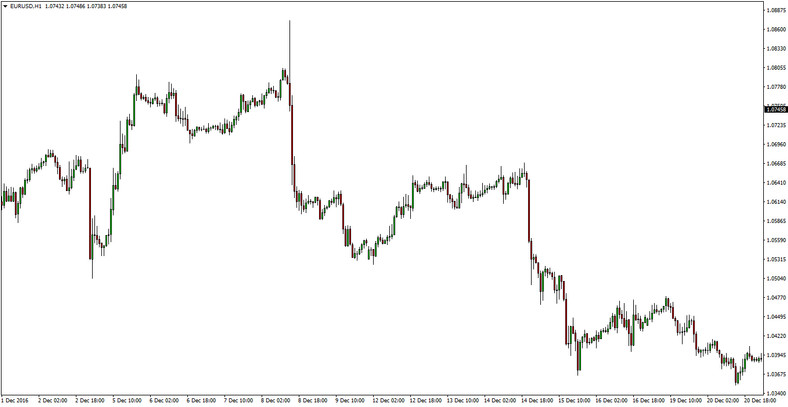
EURUSD 1h chart
On the left side of the chart, there is a small uptrend marked with the purple lines. The first push up is strong and fast, followed by a shallow retracement.
The important point on the chart here is the second swing. Notice how the second purple line is at a much flatter angle than the first, the price action is slower and over the same time length, the second swing advanced only about half as much as the first swing, and the price was rejected from the top!
This can be used as a warning sign that the current trend is losing momentum which was the case here and a strong downtrend followed.
A similar situation can be observed in the downtrend. There are 3 downswings in this segment of the chart represented by the blue lines. The first two swings are large, with fast moving price action to the downside and a steep angle. In the third line, however, all three characteristics are absent calling for our attention and putting this downtrend under question.
Indeed, the bearish trend reversed shortly after the last shallow push down.
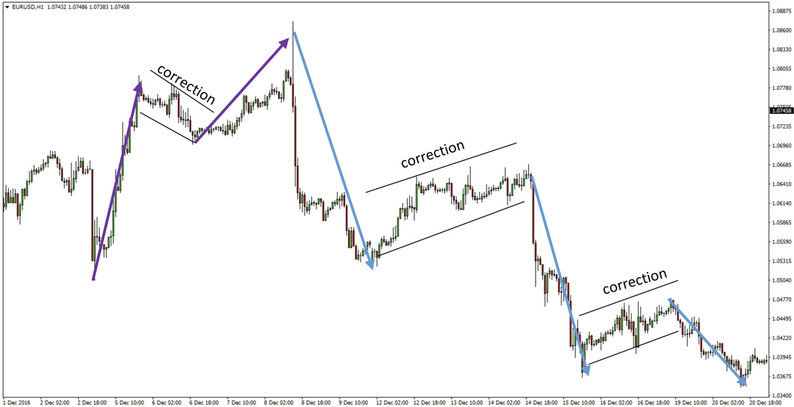
The price action slowed down before each reversal.
The main takeaways from this are:
A healthy trend will have large, fast and steep swings. As these characteristics start to die out on the chart you can expect that the end of the trend is near.
The main characteristics of a corrective swing are the opposite of a trending one:
Finally, after you master the art of reading price action you can be sure that you have advanced as a trader for several levels at least and you will be that much closer to the top class of Forex traders who consistently extract profits from the forex market.


