Does Accumulation Distribution indicator sound any familiar to you?
If not, and if you want to enter the world of trading foreign exchange, commodities, stocks or any other market with all those graphs and colored lines everywhere, then, you need to understand what it means and how to use it.
What kind of information does the Accumulation Distribution indicator provide?
The Accumulation Distribution indicator, also often referred as the A/D indicator shows the trend’s momentum in the market by incorporating money flow. If we break down the name into its two parts, we get to the purpose of this indicator. Namely, the term accumulation refers to the buying pressure in the market while the term distribution is regarding the selling force in the market.
The indicator tries to determine the dominating force in the market, either buying or selling, and thus give traders better and earlier signals for a market turn.
The Accumulation Distribution indicator is calculated based on volume (number of ticks in the MT4 for a given trading period) and price data where the volume serves as the weighting coefficient of the price factor in the calculation. As the volume increases it amplifies the price factor and so the value of the indicator increases as well, indicating greater momentum.
Does Accumulation Distribution indicator sound clearer now?
To make it easier to understand, the main role of this indicator is to determine whether there is enough buying or selling momentum in an uptrend or in a downtrend. Consequently, traders can use this information to decide whether to join a trend, stand aside or take a contrarian trade.
The accumulation happens if the day’s close is higher than the previous day’s close price. Hence, this is also known as the accumulation day. Meanwhile, the distribution happens if the day’s close is lower than the past day’s close, thus, a lot of investors and traders call this the distribution day.
With the necessary information that this indicator can provide, it becomes similar to another indicator - On Balance Volume. Both the On Balance Volume and the Accumulation Distribution are used to determine the price strength by calculating the given volume of price changes (ticks).
How would you use the Accumulation Distribution indicator?
Although this indicator is typically used for trading stocks, many traders in Forex trading use it as well. In fact, the Accumulation Distribution indicator has two major uses – trend trading and reverse trading.
Divergence plays a major role in the indicator’s effectiveness. An existing divergence is, thus, a warning sign that the trend is near an ending point, while an absent divergence and therefore an existing convergence between the price and the indicator on the chart is a sign of a healthy trend that’s potentially worth joining.
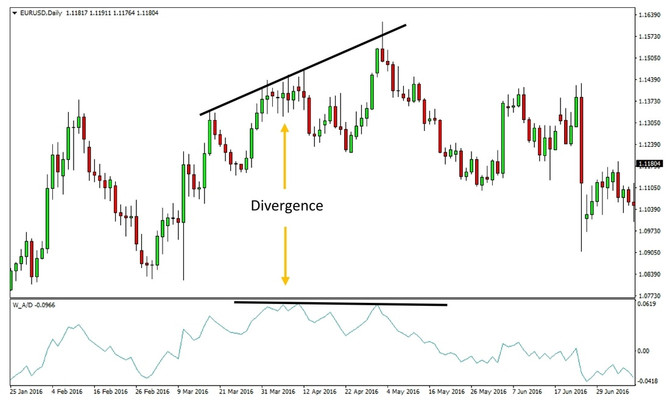
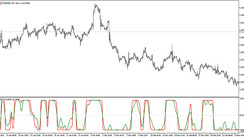
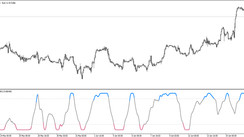
The Accumulation Distribution indicator plotted on a Euro-Dollar daily chart
How can you read this indicator?
Like any other technical indicator for trading, the Accumulation Distribution is also using a line known as the A/D line. The A/D line is plotted according to the values derived from the calculation for the A/D which is the following:

It’s also worth noting that extreme readings of the indicator are regarded as oversold or overbought levels by traders and hence very often a reversal is imminent as the market has reached these extreme levels.
Finally, an important rule to keep in mind is that the indicator very often turns ahead of price action as a leading indicator. So if the indicator starts rising but the price is still falling it’s an indication that a reversal may be nearing. Of course, like any other technical signal, any signal from the A/D indicator should be confirmed with other tools before taking a trade.

