Divergences may be a signal of a trend reversal or in some cases, a temporary change of direction in a longer-term trend. If a trader can identify trend changes early by examining divergences, the potential exists for making more profitable trades.
Also, by identifying early that a new trend is developing, a trader can maximize his earnings by entering the trade earlier and gaining more pips as the trend progresses.
This is the main advantage of trading divergences and if done properly, it can increase a trader’s success rate.
How to Identify Forex Divergences
Trading divergences is done by comparing current price action (swings) with your chosen indicator. Whenever the trend and the indicator (their swings) are giving conflicting signals, it indicates a divergence and a possible shift from the current trend. Practically any indicator - oscillator may be used to trade divergences including Stochastic Oscillator , RSI, MACD, CCI or whatever indicator the trader chooses to use.
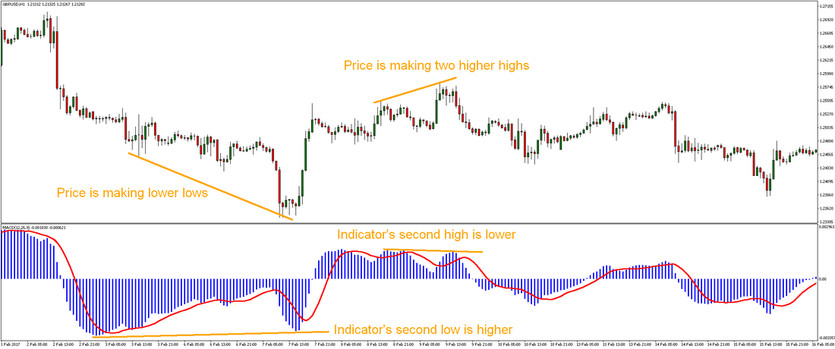
The important thing is identifying the divergences. If there is a divergence, it means that the price action and the indicator should be giving conflicting signals. Therefore, if price action is showing higher highs, the indicator should be showing lower high. Or if price action is showing lower lows, the indicator should be showing higher low.
Types of Forex Divergences
The two types of divergences are:
- hidden divergences
- regular divergences
Hidden divergence is an indication that the current trend is likely to continue, while regular divergence is an indication of a possible trend reversal.
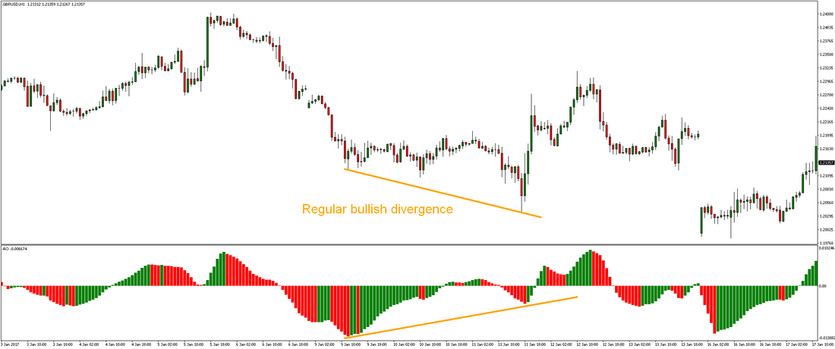
Regular Divergences
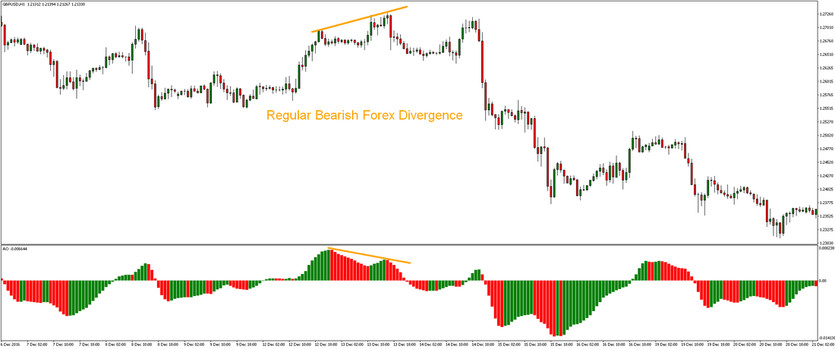
A regular divergence may be bullish or bearish. A bearish divergence is likely to occur during an uptrend and occurs at the point where price action indicates higher highs but the indicator may indicate lower high. This suggests that the current trend may be weakening and that a new down trend may be developing.
In the case of a bullish divergence, this is likely to occur during a down trend. Price action may be result in lower lows but the indicator may show higher low. Again, this suggests a weakening in momentum and the development of an uptrend.
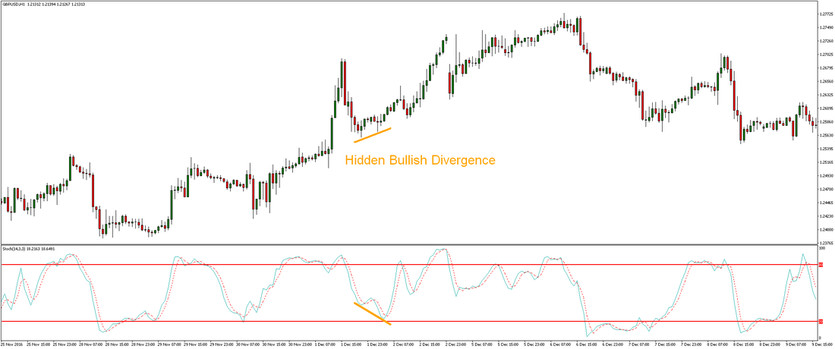
Hidden Divergences
A hidden divergence may be a little more difficult to identify than a regular divergence.
Nevertheless, a hidden divergence may be identified when the indicator shows a new extreme but the price action does not indicate this. This may be a sign of a pullback and continuation (or end of short-term correction) in the market rather than a trend reversal. Once a trader identifies this point as a hidden divergence, he has the opportunity to time his trade and gain by trading with the current trend rather than against it.
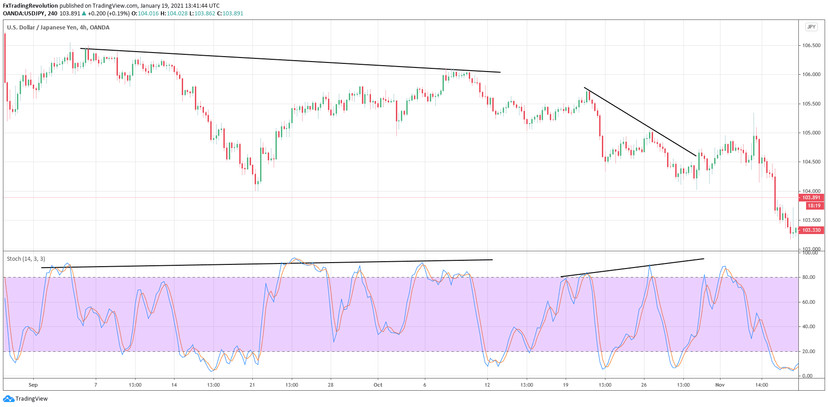
The bearish version of the hidden divergence can be seen below. Note how the hidden bearish divergence very accurately signaled further downside move of the market.
The Right Way to Trade Divergences
When it comes to trading divergences, timing is everything.
It is important that trades aren’t entered until the divergence is confirmed (and current candle signaling a possible divergence is closed). Otherwise, it is possible that the current candle's shape may change and in that case the divergence can disappear.
The trader should look for other clues that may indicate a trend reversal or a trend continuation before proceeding. For example, while the indicators and the price action may indicate a trend reversal, the occurrence of a candlestick pattern may confirm that conclusion. That is when the trade should be entered. In addition, the trader should always look for the indicator cross over before placing his trade.
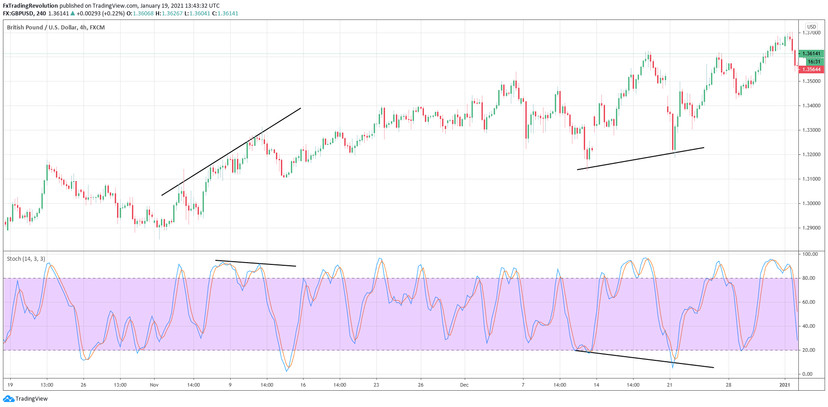
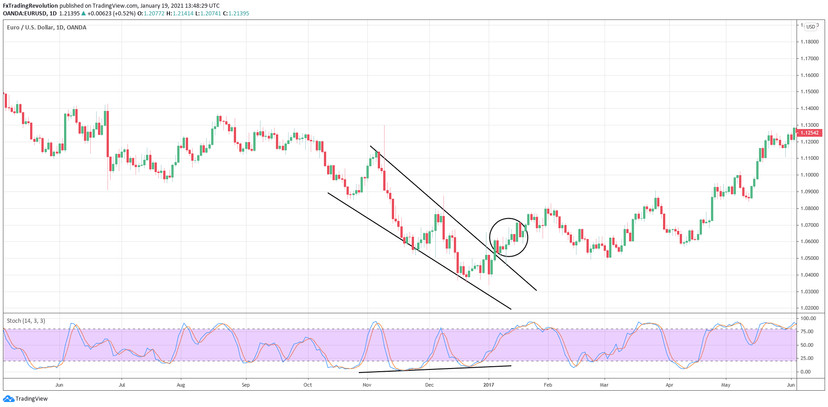
With bullish price action, trend lines should be drawn from the highs and a similar thing should be done on the indicator. With bearish price action, trend lines should be drawn from the bottoms (lows). Exactly like you can see in our charts above. It is important to be consistent in drawing trend lines either at the top or at the bottom of both price action and on the indicator. Doing otherwise may result in misleading information which would throw off the analysis.
Also one more trend line can always be drawn based on the opposite swings - like you can see at our chart below. A break below (or above in case of opposite example) the trend line is another level of confirmation that a new trend may have started.
Conclusion
It is possible for traders to make more profitable trades by trading divergences. This is done by comparing price action with an indicator and identifying conflicting (or diverging) patterns. A divergence could indicate either a trend reversal or the continuation of a trend.
Traders should wait at least for cross over on indicators before placing trades to avoid taking false divergence signals. False divergence signals may lead to losses so patience is key to profiting from divergence trading. Trend line breakouts and candlestick patterns can be used for further confirmation as well.