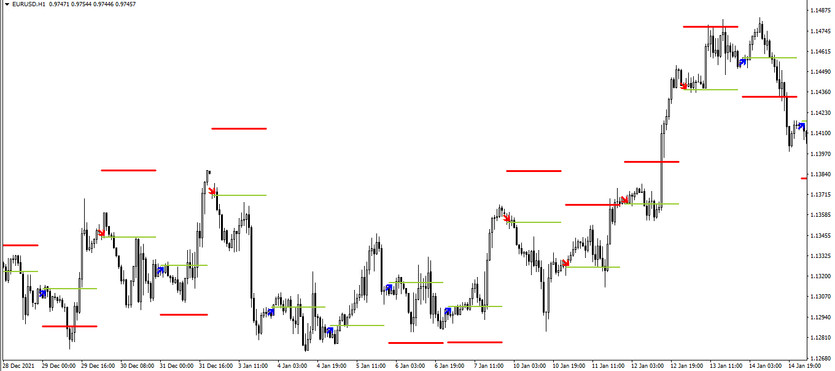
Today Trend Last is a special developed algorithm used for trend trading. The indicator allows quickly and accurately determining the current trend and indicate the candle on which it should be opened a position in its direction, in addition, the indicator can be used to place a stop loss order. Today Trend Last is represented directly on the price chart in the form of arrows of two colors, one of which is responsible for the dominance of an uptrend in the market, and the second is for a downtrend. In addition to the arrows, the indicator draws lines of two colors on the price chart, one of them helps to accurately determine the candle on which the trade is opened, and the second helps to place a stop loss order. Based on this, it can be considered that the indicator is very easy to use and does not require trader's professional skills.
The Today Trend Last indicator is suitable for use with any currency pairs, however, the timeframe is selected in the range from H1 to D1.
Input parameters
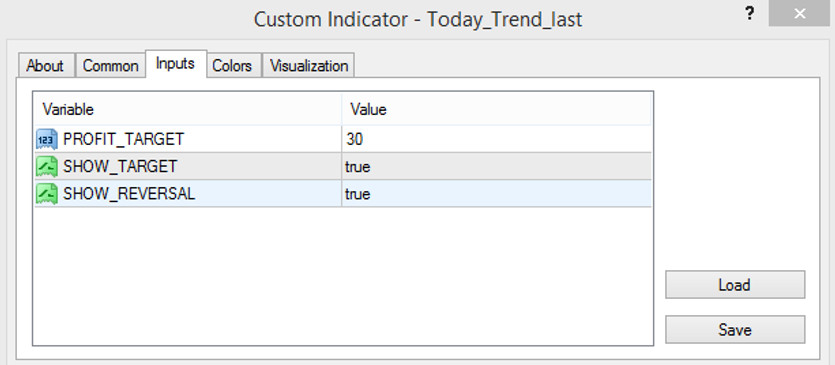
The Today Trend Last indicator has three input parameters in its settings. In addition, it has sections responsible for the color range and thickness of its values.
- PROFIT_TARGET - indicator parameter responsible for the distance of the indicator lines relative to each other. The default value is 30.
- SHOW_TARGET - parameter responsible for the presence of a line for opening positions on the chart. By default, it is set to true.
- SHOW_REVERSAL - the presence of a line responsible for placing a stop loss. By default, it is set to true.

Indicator signals
Using the Today Trend Last indicator is not difficult, since the indicator does all the main work on its own. It determines the current trend itself, finds the optimal candle and shows where it is better to set a stop loss, so it will not be difficult to figure out its signals at all. The arrows that are formed on the chart will indicate the current trend, the Target line - to the opening candle, and the Reversal line - to the stop loss point. Thus, taking into account the current trend and in compliance with all conditions, a certain position can be opened.
Signal for Buy trades:
- An arrow is formed on the chart, pointing up and having a color with the growth value.
After the appearance of such an arrow, an upward movement is determined on the market. A long position can be opened on the candle marked with the Target line. It should be closed with a stop loss at the level of the Reversal line, after an arrow with a fall value is formed on the chart. This will say about the end of the current uptrend and the beginning of a new one, allowing open new trades.
Signal for Sell trades:
- An arrow with a drop value is formed above a certain candle, pointing down.
After such an arrow forms on the current chart, a short position can be opened due to the presence of a downward trend. A trade is opened at the level of the Target line, and a stop loss is set at the level of the Reversal line. Such a trade should be closed as soon as an arrow with a reverse direction appears on the chart .In this case, the downtrend weakens and is replaced.
Conclusion
The Today Trend Last indicator is not only very simple, but also extremely effective. The indicator independently reproduces all calculations and indicates all the important details. For best results, it is recommended to use the indicator with various filters or expert advisors. It should not be difficult to use, however, to get all the necessary trading skills, it is recommended to use the indicator on a demo account.
You may also be interested The Elliott Waves Oscillator Signal trading indicator for MT4


