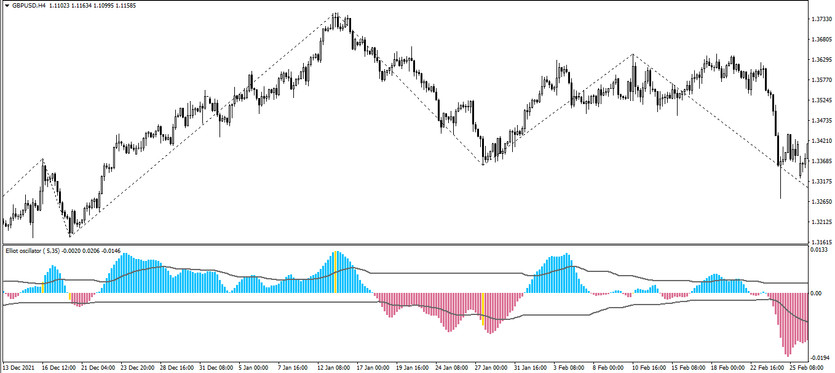
The Elliott Waves Oscillator is a modified version of the standard Elliott Waves indicator. This indicator is very effective, and therefore it is often used in trading for various purposes, for example, the indicator can determine the current trend and its strength, the moment of its weakening or change, and also identify the optimal moment to open a position in the direction of the current market movement. The Elliott Waves Oscillator indicator is presented in the lower window of the price chart as a colored histogram with a level of 0, located inside the channel formed by two moving lines. In addition, the indicator forms a zigzag line in the main chart, thanks to which it can be accurately selected the position opening candle. The position itself is opened during a certain trend period, if the desired combination, based on the indicator conditions, matches on the signal candle.
The Elliott Waves Oscillator indicator does not lose its effectiveness and works perfectly on absolutely all timeframes, from minute to monthly. The currency pair in trading is also chosen at own discretion.
Input parameters
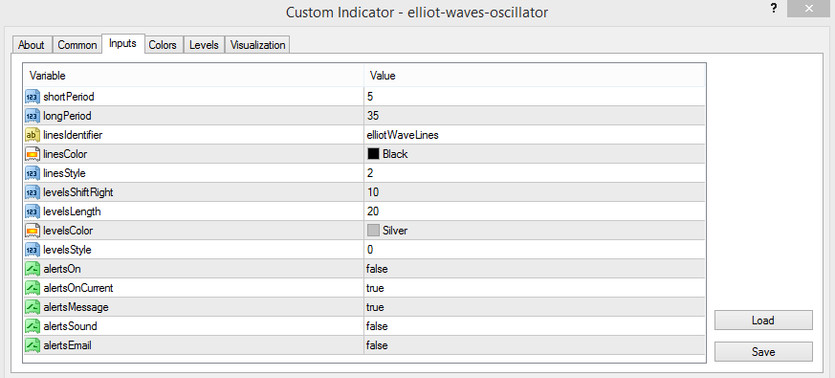
The Elliott Waves Oscillator indicator in its settings has quite advanced parameters, which allows fully adapting the indicator to own trading. Its settings consist of both important parameters that affect its calculations, and those that affect only specific conditions, for example, its visualization.
- Short Period - the period of the fast moving average, the difference with which is the main part of the indicator's calculations. The default value is 5.
- Long Period - the period of the slow moving indicator used to make the difference from the fast moving indicator for making calculations. The default value is 35.
- Lines Identifier - attribute of the lines used by the indicator. The default value is Elliot Waves Lines.
- Lines Color - the color of the indicator lines. The default value is Black.
- Lines Style - type of smoothing of the moving lines of the indicator. The default value is 2.
- Levels Shift Right - deviation of the line values in the direction to the right. The default value is 10.
- Levels Length - the length of the signal levels used by the indicator. The default value is 20.
- Levels Color - the color of the signal levels of the indicator. The default value is Silver.
- Levels Style - visualization type of the indicator's signal levels. The default value is 0.
- Alerts On - parameter responsible for the operation of alarm notifications. The default value is false.
- Alerts On Current - signal playback parameter on the current candle. The default value is true.
- Alerts Message - parameter responsible for sending a notification as a message to the main window of the price chart. By default, it is set to true.
- Alerts Sound - option to play a sound notification when a signal is received. The default value is false.
- Alerts Email - option to send a notification to a previously specified email. The default is false.

Indicator signals
When trading and using the Elliott Waves Oscillator indicator, it is needed to take into account several of its values at once, and look for a candle that matches the exact combination consisting of its conditions, or turn on the signal parameter and just wait for the candle on which the indicator will generate its signal. Indicator signal is formed taking into account the location of its histogram relative to the level 0, its color, location relative to the moving average channel, as well as the location of the signal candle relative to the zigzag line. And as soon as such conditions are formed on a certain candle in a certain way, a position can be opened in the direction with the current trend.
Signal for Buy trades:
- The signal candlestick is located above the zigzag line of the indicator.
- The histogram of the indicator is located above the signal level 0 and has a color with a value of growth, and rises above the upper limit of its channel.
After all these conditions match on a certain candle, a long position can be opened, due to an uptrend in the market. Such a trade should be closed after the histogram falls below the 0 level, or at least one of its columns turns into a neutral color. This will talk about the end of the current trend or its weakening, and by this moment it is better to prepare for the opening of new trades.
Signal for Sell trades:
- The signal candle must be below the zigzag line of the indicator.
- The histogram of the indicator has a color with a falling value and is below level 0, while falling below the moving channel.
Upon receipt of such a combination of conditions, a short position may be opened on a certain candle. It should be closed after the histogram changes its direction relative to level 0 or at least one of its columns acquires a neutral hue. This may indicate the end or weakening of the current downward trend, and at this point, it can be considered opening new trades.
Conclusion
The Elliott Waves Oscillator indicator is a complete trading algorithm, thanks to which it can be quickly and efficiently made any trade. Its signals are very accurate, and therefore trades made with it are quite profitable. If the indicator causes some difficulties in using, then before applying Elliott Waves Oscillator in practice, it is recommended to use it in advance on a demo account.


