The Parabolic SAR is a very unique indicator. It is displayed in a completely different way from other indicators, and its usage is very diverse.
The Parabolic SAR is used not only for entry judgment but also for cutting losses and placing stops. This Parabolic SAR indicator ("MTF_ParabolicSAR") for MetaTrader 4 that we introduce in this article is a multi-timeframe version of the standard Parabolic SAR.
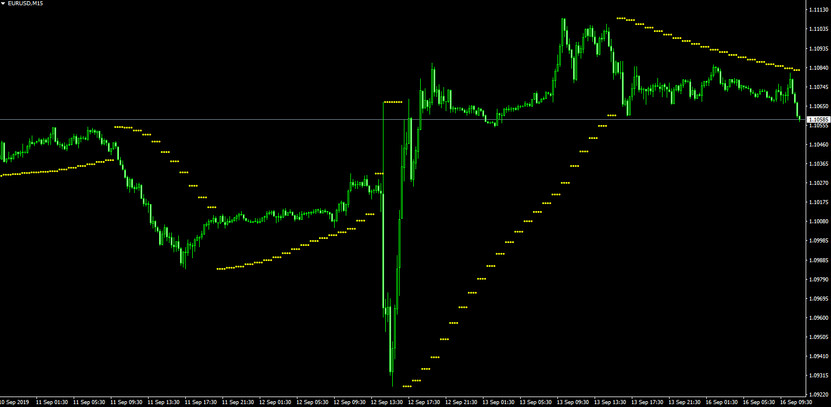
Example of displaying the 1-hour Parabolic SAR on a 15-minute chart
By using this indicator, values of the Parabolic SAR of other time frames can be displayed on the chart. It is also possible to display the Parabolic SAR of the weekly time frame on the 1-hour time frame.
However, be careful when displaying the parabolic SAR of the lower time frame on the chart of the upper time frame (for example, displaying the parabolic SAR of the 1-hour chart on the 4-hour chart).
Tips for using:
1. It is a good idea to build a trading strategy together with a normal parabolic SAR (of the active timeframe) that uses the Parabolic SAR for entry. For example, a rule can be determined such as “enter only when a parabolic SAR in the upper time frame and a normal parabolic SAR appear in the same direction at the same time”. The following image is an example of an entry according to this rule.
Display 15-minute chart Parabolic SAR (green) and 1-hour chart Parabolic SAR (yellow)
2. The Parabolic SAR can also be used for loss cutting and profit determination. For example, in the image below, the 15-minute chart shows the Parabolic SAR (green) of the 15-minute chart and the Parabolic SAR (yellow) of the 1-hour chart.
As you can see, the exit can be delayed by using the 1-hour Parabolic SAR on the chart which gives an exit signal later compared to the normal Parabolic SAR. Depending on the strategy, it may be better to delay the exit timing in this way. In such a case, using the "MTF_ParabolicSAR" can provide an advantage as is evident from the chart shown here.
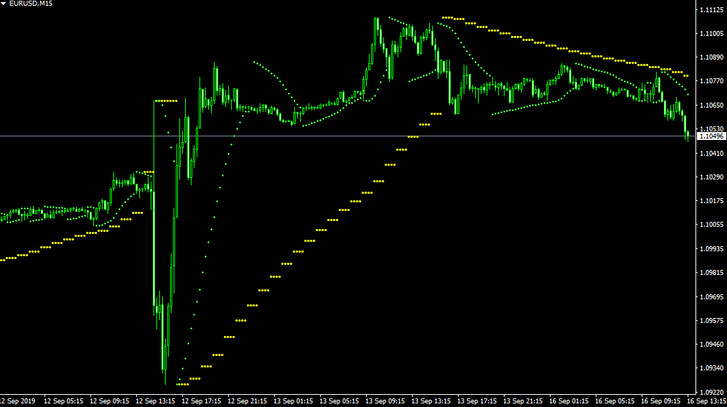
It can be seen that the parabolic SAR (green) of the 15-minute chart and the behavior of the parabolic SAR (yellow) of the 1-hour chart are quite different.
Compatibility: MT4
Parameters:
- TimeFrame - Defines the timeframe of the indicator
- Step - Defines the rate-of-change of the indicator
- Maximum - Defines the maximum of the step
Download the "MTF_ParabolicSAR" indicator from the button below
Tip: Can’t open the downloaded archive file (ZIP or RAR)?
Try WinRAR for Windows or The Unarchiver for Mac .
Do you need help with installing this indicator into MT4 for Windows or Mac OS? Our guide HERE will help you.