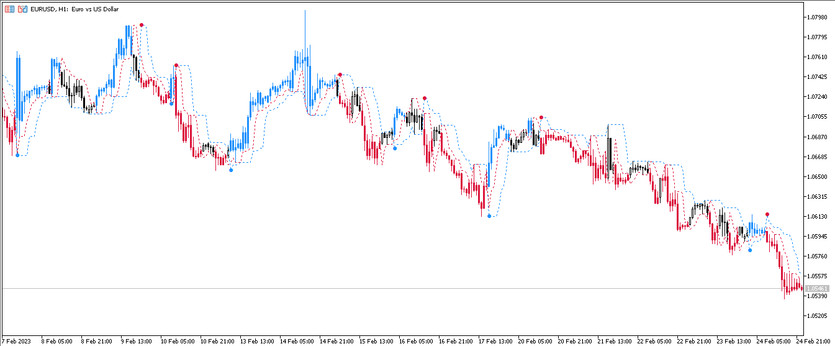
Perfect Trend Line 2 is a special algorithm that is used exclusively for trend trading. Its calculations are aimed at determining the direction of the current market trend, its strength and trading in this period directly. The indicator is displayed in the main window of the price chart as a pair of intersecting lines, while the indicator also paints the current candles in a certain color, allowing select the opening candle using the presence of dots at the intersection of the lines. When opening a trade, all these indicator values are taken into account.
The Perfect Trend Line 2 indicator works equally effectively when choosing any currency pairs and timeframes, so any values can be used.
Input parameters
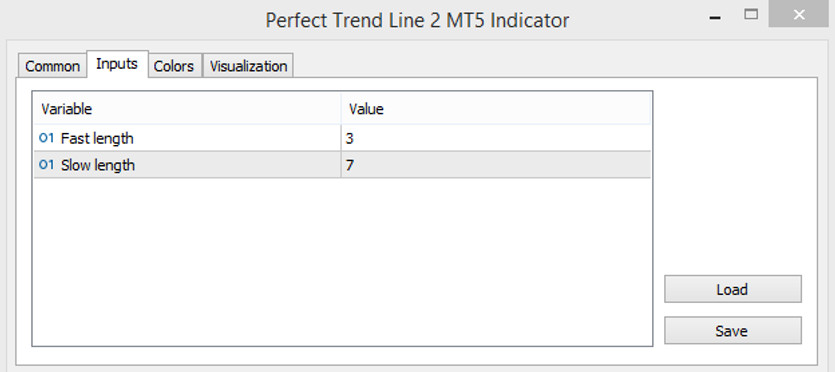
The Input Parameters section in the indicator settings is not advanced, and the values of its parameters mainly affect its technical operation. While the Colors section serves as a visualization tool, namely to change the color gamut and thickness of values.
- Fast length - the period of the indicator's fast line. The default value is 3.
- Slow length - parameter responsible for the value of the period of the slow indicator line. The default value is 7.

Indicator signals
The Perfect Trend Line 2 indicator is a very easy-to-use trading algorithm. To open a certain trade, the current trend is determined using the indicator. To do this, in turn, one should take into account the direction of the lines, their location after crossing, the color of the dot and the current candles. If the indicator determines an uptrend, long positions are opened, if the trend is down, short positions. Trades are closed at the moment the current trend changes.
Signal for Buy trades:
- Indicator lines move from bottom to top and intersect so that the fast one is higher than the slow one and a point with a growth value is formed. All current candles have a color with a growth value.
When a full combination of such conditions is received on a signal candle, a buy trade can be opened, due to the presence of an uptrend in the current market. Such a trade should be closed when the current trend changes, namely, when the lines cross again, which in turn will allow considering the opening of new trades.
Signal for Sell trades:
- Indicator lines intersect so that the slow one is higher than the fast one. At the place of their intersection, a point with a falling value should form. Current candles should also be colored with a falling value.
A sell trade can be opened upon receipt of such conditions on a signal candle. This will indicate the presence of a downward trend in the current market. Such a trade should be closed upon receipt of a reverse intersection of the lines. At this moment, a trend change is expected, which will allow considering opening new trades.
Conclusion
The Perfect Trend Line 2 indicator is a very accurate and efficient trading algorithm that allows trading in a certain trend period. Although the indicator is very easy to use, prior practice on a demo account is recommended to gain the necessary trading skills.
You may also be interested The SSM RSI Pivots Trend trading indicator for MT5


