The indicator introduced here is particularly unique. This MT4 indicator "PriceActionOverLay" displays useful information on the main chart based on past price movements. This indicator can be used in a variety of ways, but it should be especially useful for those who like contrarian and reversal trading.
Example of displaying this indicator on the EURUSD 15-minute chart
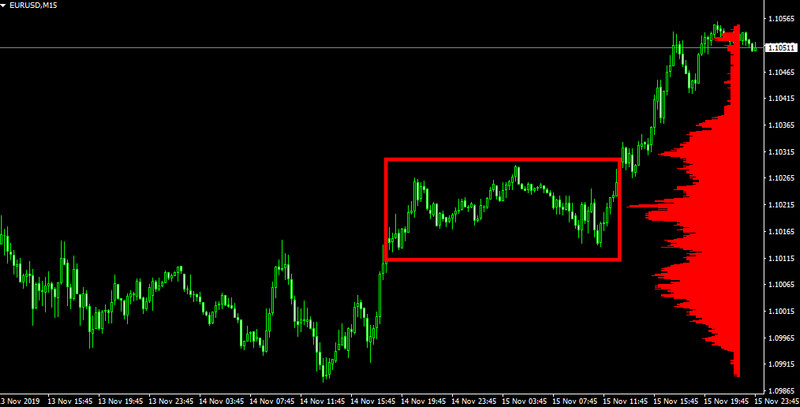
This indicator shows a red graph on the trading volume on the chart. For example, in the price range where trading is often performed, the numerical value of the graph also becomes high. On the other hand, in the price range where transactions are quiet, the value of this graph is also low.
Look at the image below.
You can see that the market is in the range for a relatively long time in the area enclosed by the square. That means that there is a lot of trading volume in this price range, and the numerical value of the graph displayed by this indicator will be high.
Tips on how to use:
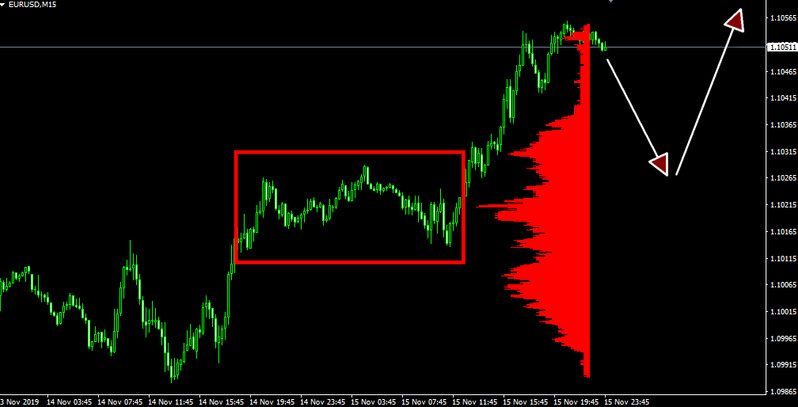
The high price range of this indicator may be a potential resistance zone/support zone.
In the above image example, the price range (1.1015 to 1.1030) enclosed by a square can be considered as a potential resistance zone. For this reason, if the price drops to this price range in the future, you can place a buy order in anticipation of the price rebounding in this price range (see image below).
Compatibility: MT4
Parameters:
- Number of bars used for calculation
- Step-specify calculation density
Download the "PriceActionOverLay" indicator from the button below
Tip: Can’t open the downloaded archive file (ZIP or RAR)?
Try WinRAR for Windows or The Unarchiver for Mac .
Do you need help with installing this indicator into MT4 for Windows or Mac OS? Our guide HERE will help you.

