RSI + CCI is an algorithm based on the functioning of two indicators included in the standard Forex set. One of the indicators determines the trend and its strength, as well as the possibility of its change, and the second determines the probability of overbought or oversold in the market, however, it is able to determine the trend and its direction. Combining these tasks, the RSI + CCI indicator is used to find the optimal moment to enter the market, after determining the current trend or its absence altogether.
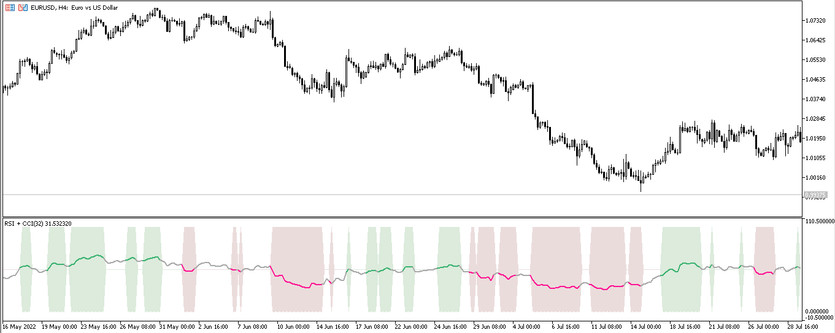
The indicator is displayed in the lower window of the price chart as a line, which, when certain conditions are received in any color, while being in the zone of the current trend or lateral movement. The indicator is very effective, regardless of the selected timeframe or currency pair.
Input parameters
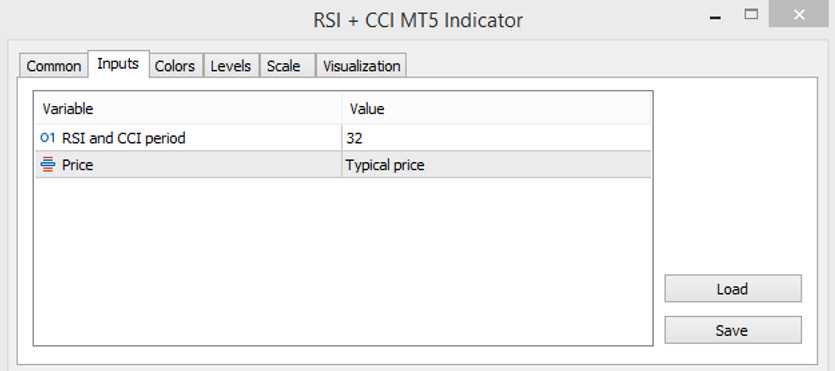
Despite the fact that RSI + CCI is a small strategy based on two indicators, there are only two input parameters in its settings. But besides this, in its settings there are sections for changing the color gamut and thickness of indicator values, as well as adding to signal level indicator window.
- RSI and CCI period - parameter responsible for the period of RSI and CCI, which form the basis of the indicator. The default value is 32.
- Price - value of the price type to which the indicator calculations will be applied. By default, it has the Typical price value.

Indicator signals
The signals of the RSI + CCI indicator are based on the direction and color of the indicator line, as well as its presence in the trend zone. That is, it is necessary to trade using the indicator when there is a trend in the market. If it is opened a trade during the absence of a trend, that is, during a sideways movement, then the trade will be unprofitable. If the line is in the uptrend zone, then a long position should be opened, and if in the downtrend zone, a short position.If a sideways movement is determined in the market, then all current trades are closed, and new ones are temporarily not opened.
Signal for Buy trades:
- An uptrend is determined on the market. That is, the indicator line is in the positive zone.
- It is important that the line itself is directed upwards and has a color with a height value.
Upon receipt of such conditions, a buy trade can be opened on a certain candle. Such a trade should be closed after the indicator line leaves the positive zone, this will indicate the end of the uptrend. At this moment, it is needed to be ready to open a new position if the market lateral movement is not detected.
Signal for Sell trades:
- The line of the indicator of the beginning of the movement is in the negative zone, thus a downward movement is determined in the market.
- At the same time, the indicator line, having turned into a color with the value of the fall, should move down.
After such conditions match on a certain candle, a short position can be opened, which should be closed when the line exits the downtrend zone. At this moment, it can be prepared to open new trades, of course, if there is no sideways movement in the market.
Conclusion
The RSI + CCI indicator is used in trading with a trend, which it determines with the help of its calculations. This allows trading with a higher probability of making a profit. Despite the fact that the indicator is a small strategy, it is very easy to use, as it can be seen when practicing on a demo account.


