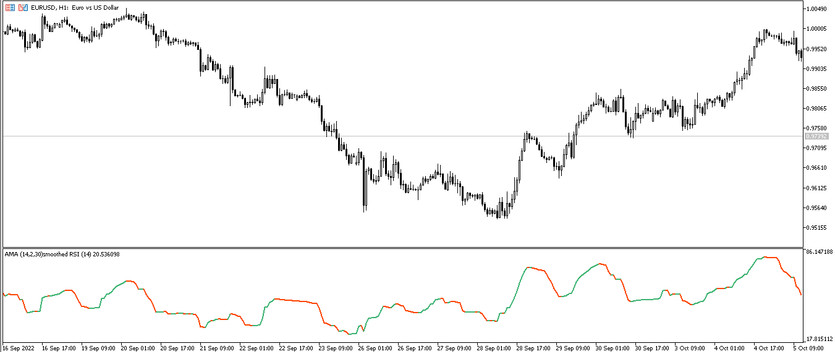
The AMA Smoothed RSI is a trading algorithm developed on the basis of two effective indicators, namely two different-period modification moving averages and the RSI indicator. The indicator obtained on their basis is used in trading to identify the current trend, and thereby search for the optimal moment to enter the market during the period a certain trend. The indicator is represented on the chart as a solid moving line, which, upon receipt of certain market conditions, is painted in one of two colors, one of them is responsible for an uptrend, and the second for a downtrend. And thus, determining the current trend, it can be easily and quickly opened a trade in its direction.
The AMA Smoothed RSI indicator is suitable for use on any time frame, with any currency pairs.
Input parameters
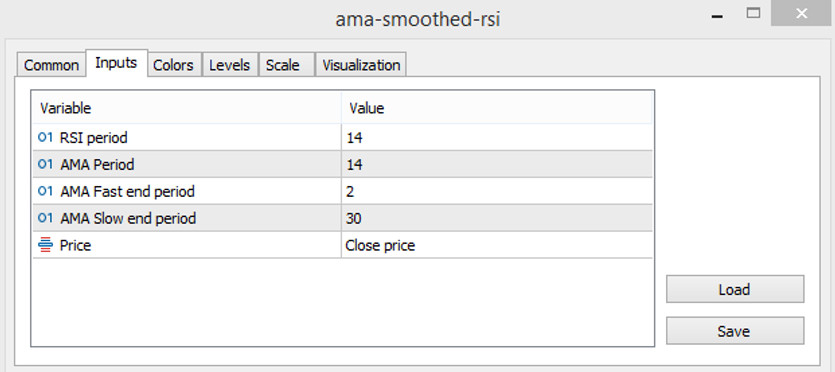
In total, there are five input parameters in the settings of the AMA Smoothed RSI indicator. The AMA Smoothed RSI indicator includes two indicators, and therefore some of the input parameters in its settings relate to AMA, and others to RSI. The rest of its sections are responsible for the color scheme of the indicator, as well as adding signal levels to its window.
- RSI period - period of the RSI indicator. The default value is 14.
- AMA period - AMA indicator period. The default value is 14.
- AMA Fast end period - parameter responsible for the fast moving average period. The default value is 2.
- AMA Slow end period - value of the period of the slow moving average. The default value is 30.
- Price - type of the price to which the indicator's calculations will be applied. By default, it has the Close price value.
Indicator signals
Considering the signals of the AMA Smoothed RSI indicator, which allow determining the current trend, should be considered at the moment when its line turns into a certain color and moves in a certain direction. And taking into account these conditions, namely the color and direction of the line, a position can be opened in direction with the current trend. Thus, if an uptrend is determined, then a buy trade, and if the trend is down, then a sell trade.
Signal for Buy trades:
- The indicator line moves up and is colored in color with the growth value.
As soon as the indicator line acquires these values, a buy trade can be opened. It should be closed upon receipt of the opposite conditions, namely, a change in the color and direction of the line. At this moment, it should be prepared for a change in the current uptrend and prepare to open new trades.
Signal for Sell trades:
- The indicator starts moving down, while it is colored with the value of the fall.
As soon as the indicator line acquires such values, a sell trade can be opened, which should be closed when the reverse signals are formed. That is, as soon as the indicator line changes its direction and color, a downtrend change can be expected, which will allow opening new trades during a new market movement .
Conclusion
The AMA Smoothed RSI indicator not only limits risks and losses due to its efficiency, but is also very easy to use, which allows even novice traders to trade with it. However, in any case, it is better to use a demo account before using the indicator in practice.
You may also be interested The CCI Squeeze Trading Indicator for MT5

