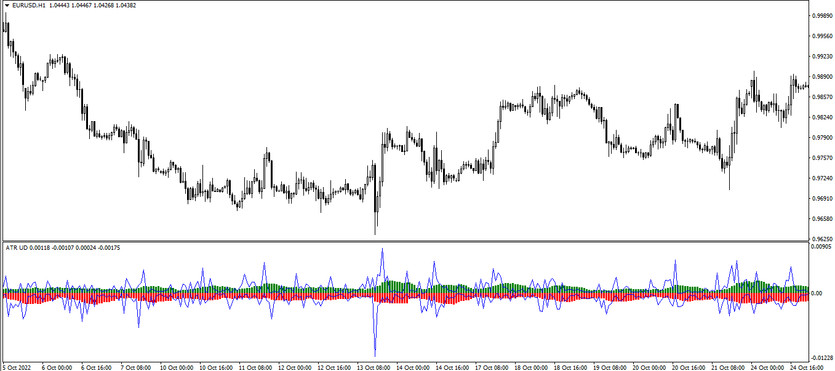
The ATR Up and Down is a modified version of the ATR indicator, which is included in the standard Forex set. To perform calculations, the indicator uses the average value between the price difference between High and Low, Open and Close for a certain period of time. This information allows keeping abreast of volatility and price changes on market, thus allowing open trades in time at the moment of determining the current trend and at the same time correctly place protective orders. The ATR Up and Down indicator is presented in the lower window of the price chart as a histogram, the columns of which are directed up and down, while the indicator window also has a channel made up of lines, which also allows determining the price difference related to one or more candles.
The ATR Up and Down indicator can be used on any timeframe, with any currency pairs, as it works equally effectively when choosing any values.
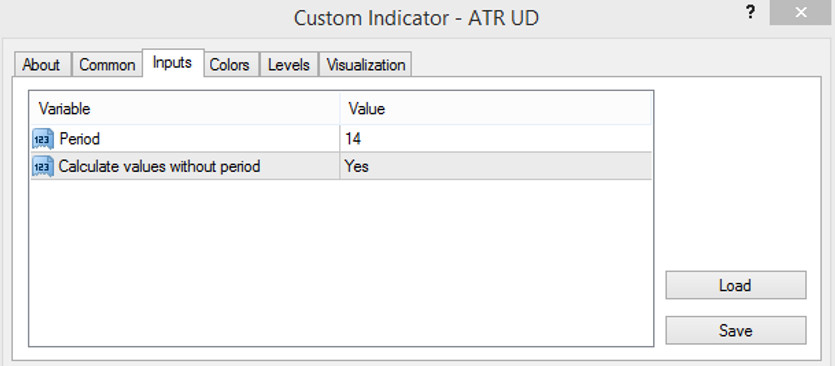
Input parameters
The indicator has only two input parameters in its settings, which are responsible for some technical tasks of the indicator. Changing them allows more accurately adjusting the indicator to own trading.
- Period - indicator period value. The default value is 14.
- Calculate values without period - indicator parameter that is responsible for performing calculations between the average price value and indicator indicators. The default value is Yes.
Indicator signals
The ATR Up and Down indicator is considered a very reliable trading assistant. Thanks to its calculations, it can help to be aware of all its price values, while it also serves as a good helper in determining the current trend and opening trades in its direction. It is very important to consider that for an accurate when choosing the moment of opening a trade, it is recommended to use additional indicators or advisers, since the indicator is not so accurate in this regard. However, to open a certain positon, it is needed to take into account the length of the indicator columns and the width of the histogram as a whole. If the bars with a growth value are longer than the opposite ones, the market is in an uptrend, if on the contrary, the color bars with a falling value are longer, then the trend is down.
Signal for Buy trades:
- At least three bars of the color histogram with a rising value higher than or at the same level as bars with a falling value.
Upon receipt of such a condition on a candle, which in turn can be confirmed by an additional indicator or adviser, a long position may be opened. At the same time, this will also indicate the presence of an upward trend in the market. Such a position should be closed after columns with growth values begin to form, which will be above the columns with the growth value.
Signal for Sell trades:
- Histogram bars with falling values are longer than those with rising values.
After receiving such a signal, which characterizes the presence of a downward trend, a sell trade is opened. Such a trade should be closed immediately after the histogram columns with a fall value become smaller than the columns with a growth value.
Conclusion
The ATR Up and Down indicator is a very effective and reliable trading tool, just like its standard version. It allows not only to determine the current price information about the market, but also to determine the prevailing trend in a certain period, which in turn also allows opening trades correctly. However in order to learn how to correctly determine the moment of opening a position, it is recommended not only to use additional indicators and advisers, but also to use a demo account first.
You may also be interested The Smoothed Rate of Change trading indicator for MT4