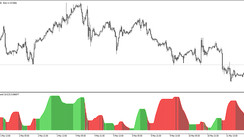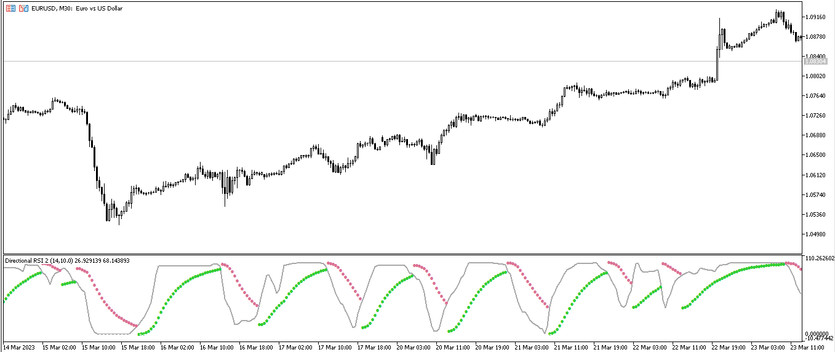
Directional RSI is a trading algorithm based on a modification of the standard RSI forex indicator using Parabolic SAR as an additional one. Thus, the Directional RSI indicator makes calculations aimed at determining the direction of the current trend and opening trades in this period. It is presented in the lower window price chart in the form of the main RSI line with a line of dots Parabolic SAR, which serves as a signal line. Trades are opened taking into account the indicator signals that determine the direction of the current trend.
The Directional RSI indicator is suitable for use on any timeframe, with any currency pair.
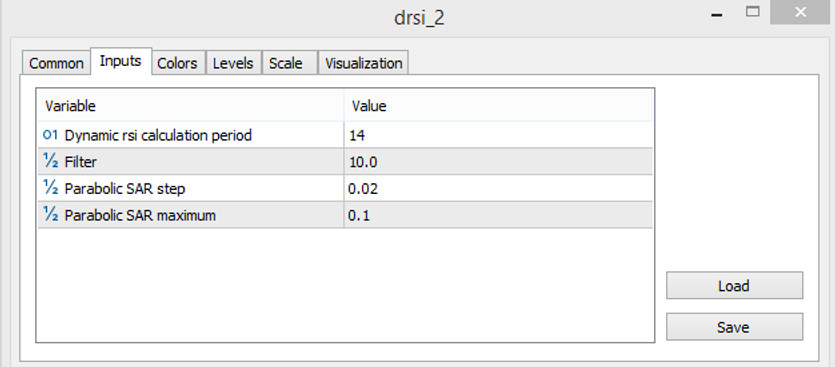
Input parameters
The settings of the Directional RSI indicator consist of several sections. Thus, the Input Parameters section is used to perform technical work of the indicator. The Colors section is used to change the general visualization and color scheme, and the Levels section is used to add signal levels to the indicator window.
- Dynamic RSI calculation period - value of the RSI indicator calculation period. The default value is 14.
- Filter - value of the indicator signal filter period. The default value is 10.0.
- Parabolic SAR step - step value of the Parabolic SAR indicator. The default value is 0.02.
- Parabolic SAR maximum - the maximum value of the calculation of the Parabolic SAR indicator. The default value is 0.01.
Indicator signals
The Directional RSI indicator, due to its convenient visualization, is very easy to use. To open a certain trade, the indicator should determine the current market trend. To do this, it should be taken into account the direction of the indicator lines and their location relative to each other. If the indicator determines an uptrend, long positions are opened, in a downtrend, short positions are opened. In both cases, positions are closed during a change in the direction of the current trend.
Signal for Buy trades:
- Both indicator lines are moving up. The signal line has a color with a growth value and is located below the main one.
Upon receipt of such a condition on a signal bullish candle, a buy trade can be opened, due to the presence of an uptrend in the current market. Such a trade should be closed when the trend direction changes, that is, at the moment the direction of the indicator lines changes and the color of the signal line changes. At this moment, it should be prepared to open new trades.
Signal for Sell trades:
- The indicator lines move from top to bottom. At the same time, the signal line has a color with a falling value and is above the main one.
A short position, determined by the presence of a downtrend in the current market, can be opened immediately upon receipt of such conditions. It should be closed upon receipt of a return signal from the indicator, namely at the moment of changing the direction of the lines and changing the color of the signal. At this moment, the current trend is expected to change, which in in turn will allow considering the opening of new trades.
Conclusion
The Directional RSI indicator is a very effective trading algorithm, since its calculations are based on the functioning of accurate time-tested indicators. To improve the accuracy of the indicator signals, it is recommended to use the indicator with additional advisers, filters and other indicators. Preliminary practice on a demo account is also recommended.
You may also be interested The Trend Continuation Factor trading indicator for MT5