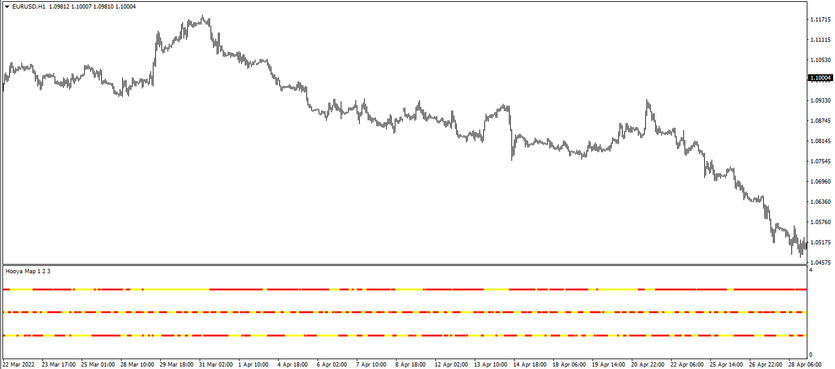
Hooya Map is a trading algorithm, the calculations of which are based on the interaction of the MACD, Stochastic and MA indicators, which in turn are included in the standard forex set. Trading with the indicator takes place during a certain trend in the current market. Thus, the Hooya Map indicator is used to determine the direction and strength of the current trend and open trades in this period directly. It is displayed in the lower window of the price chart as 3 lines made up of dots of a certain color, while the lines, in turn, are arranged in three rows, like signal levels. Thus By determining the current trend using the indicator values, the opening of new trades can be considered.
The Hooya Map indicator is suitable for use on any timeframe with any currency pair.
Input parameters
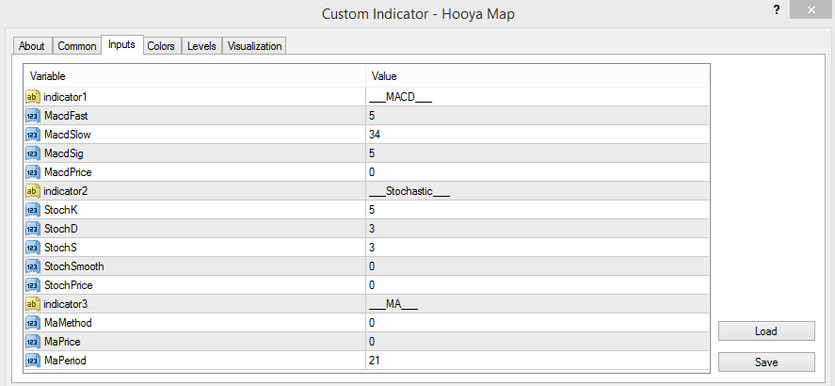
The settings of the Hooya Map indicator consist of an extended list of input parameters that affect its technical operation, while its input parameters are associated with the settings of the indicators included in the algorithm.
MACD
- MacdFast - the period of the fast moving average of the MACD indicator. The default value is 5.
- MacdSlow - slow moving MACD period. The default value is 34.
- MacdSig - period of the signal line of the MACD indicator. The default value is 5.
- MacdPrice - type of price to which MACD indicator calculations are applied. Default value is 0.
Stochastic
- StochK - period of the main line of the Stochastic indicator. The default value is 5.
- StochD - period of the D Stochastic signal line. The default value is 3.
- StochS - period of the signal line of the indicator. The default value is 3.
- StochSmooth - type of smoothing of moving averages of the indicator. The default value is 0.
- StochPrice - type of price to which the indicator calculations are applied. The default value is 0.
MA
- MaMethod - type of smoothing of moving average values. The default value is 0.
- MaPrice - type of price for which the moving average is calculated. The default value is 0.
- MaPeriod - value of the period of the moving average. The default value is 21.

Indicator signals
The Hooya Map indicator is very easy to use due to its convenient and clear visualization. To open a certain trade, it should be taken into account the indicator values, namely the current color of the dots arranged in three levels. If the current trend is strong up, long positions are opened, if the trend is strong down, short positions. At the same time, the trade is temporarily not opened if at least one row of dots is colored in the opposite color. The trade should be closed when the opposite conditions are received in at least one row of indicator lines.
Signal for Buy trades:
- All three rows of indicator lines are colored with growth value.
Upon receipt of such a condition on a signal bullish candle, a buy trade can be opened, due to the presence of an uptrend in the current market. Such a trade should be closed upon receipt of the opposite condition in at least one row of the indicator line. At this moment, a change in the current trend is possible, which in turn will allow to consider the opening of new trades.
Signal for Sell trades:
- Indicator lines consisting of dots are colored with the fall value.
A sell trade can be opened immediately upon receipt of such a condition on a signal bearish candle. This will indicate the presence of a downtrend in the current market. Such a trade should be closed when the color of at least one indicator line changes. At this moment, the current trend is expected to change, which will allow to consider opening new trades.
Conclusion
The Hooya Map indicator is a very efficient trading algorithm, as its calculations are based on the functioning of very accurate indicators. In addition, the indicator is very easy to use and suitable for traders with different levels of experience. At the same time, in order to strengthen trading skills and the correct use of the indicator, preliminary practice on a demo account is recommended.
You may also be interested The IINWMarrows Trading Indicator for MT4


