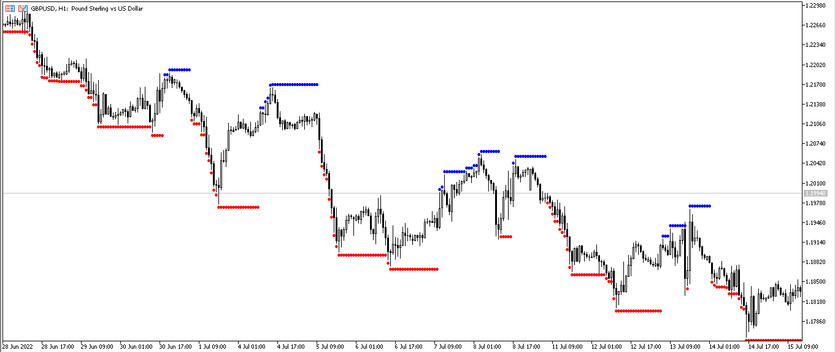
The MACD Top Bottom is a trading algorithm that was developed to find the optimal moment to enter the market by designating the upper and lower levels on the price chart. The MACD Top Bottom indicator is a modification of the standard forex MACD indicator, and, accordingly, based on calculations of the standard version. It is presented directly on the price chart in the form of dots, which in turn form lines of different sizes, which are located above or below the candles. The indicator is used to open trades, the direction of which is determined taking into account the location of the price relative to the upper or lower level.
The MACD Top Bottom indicator, like its standard version, is suitable for any currency pairs and timeframes, as it is equally effective when choosing any values.
Indicator parameters
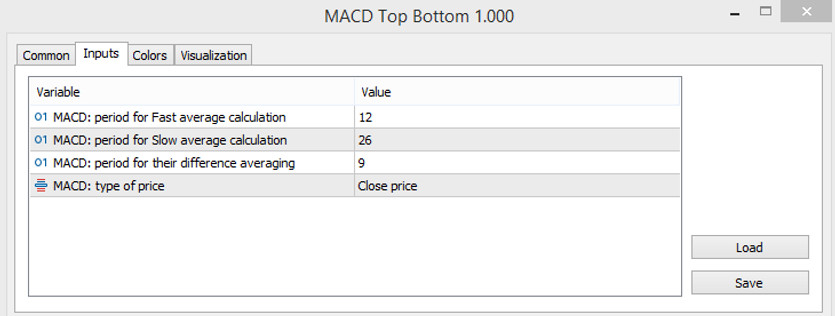
The settings of the MACD Top Bottom indicator consist of input parameters that directly affect its general calculations and operation. The Colors section in its settings is used to change the color scheme and thickness of its values.
- MACD: period for Fast average calculation - the period of the fast moving average of the MACD indicator. The default value is 12.
- MACD:period for Slow average calculation - MACD slow moving average period value. The default value is 26.
- MACD:period for their difference averaging - the period for the difference in moving average values. The default value is 9
- MACD:type of price - type of price to which the indicators are applied. By default, it has the Close price value.

Indicator signals
The MACD Top Bottom indicator is used in trading to find the optimal moment to open positions. This is done at the moment when the indicator draws dots of a certain color and location relative to the current candles on the chart. That is, as soon as a certain line of dots appears on the chart, and as soon as the certain candle reaches its level, a trade can be opened. If the signal candle reaches the upper level of the indicator, a buy trade is opened, and if it is lower, then a sell trade is opened.
Signal for Buy trades:
- A line appears on the chart, made up of color dots with a growth value and located above the current candles.
As soon as a certain candle reaches this level, a long position may be opened. It should be closed after the next line of indicator dots appears. This may indicate the possibility of a change in the direction of current trades.
Signal for Sell trades:
- A line appears under the current candles, formed by dots that have a color with a falling value.
When such a signal appears, a short position can be opened on a certain candle that reaches this level. It should be closed when the next line consisting of dots is formed. At this moment, one should consider opening trades in the other direction.
Conclusion
The MACD Top Bottom indicator is a very effective trading algorithm, as it is based on the time-tested MACD indicator. It is also extremely easy to use, making it accessible even to beginners. However, in order to gain certain skills in trading and using the indicator, preliminary practice on demo account is recommended.
You may also be interested Corrected AMA trading indicator for MT5


