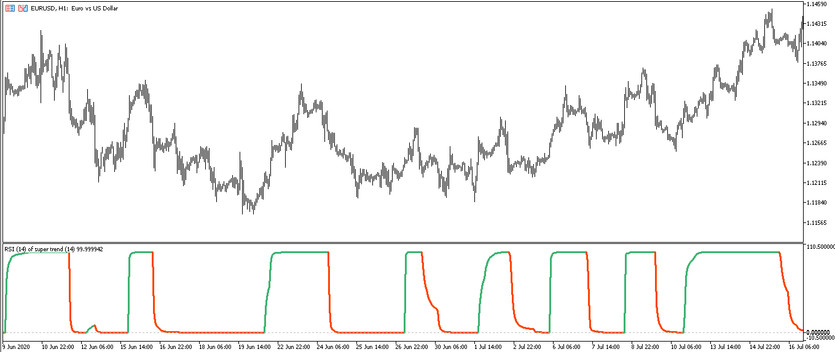
The RSI of Super Trend trading indicator is an algorithm based on the functioning of several trend indicators. The RSI of Super Trend, like the indicators taken as its basis, works for trend trading. That is, trades using the indicator only during a certain trend and taking into account its direction. The indicator is presented in a separate lower window of the price chart in the form of a line that is always above the 0 level, but at the same time moves up or down, painting in one of two colors, which in turn characterize a certain trend on market. In order to open a certain trend, it is just needed to determine the current trend by taking into account the indicator values of the indicator line.
The RSI of Super Trend indicator works equally effectively on any timeframes, with any currency pairs, so their choice is not limited to certain values.
Input parameters
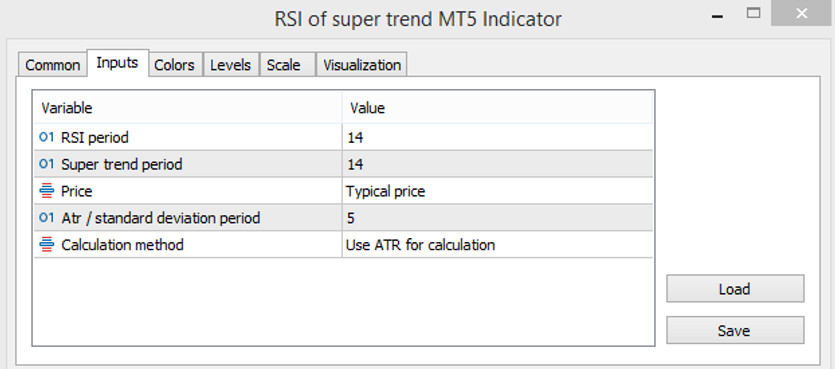
The RSI of Super Trend indicator settings consist of sections that affect its visualization, such as Colors and Levels, and its general operation, such as Input Parameters. It is recommended to change the values of each input parameter taking into account other trading units in order to form a convenient trading method.
- RSI period - value of the period of the RSI indicator. The default value is 14.
- Super Trend period - Super Trend indicator period. The default value is 14.
- Price - type of the price to which the indicator calculations are applied. By default, it has the Close price value.
- Atr/standard deviaton period - parameter responsible for the deviation of the indicator values from the standard ones. The default value is 5
- Calculations method - method for deviation of indicator values. By default, it is set to Use ATR for calculation.

Indicator signals
The method of applying the RSI of Super Trend algorithm in practice is very simple. To start trading, that is, to open a certain trade, it is first needed to determine the current trend. To do this, it is needed to take into account the indicator values, namely the color and direction of its line. If these values characterize an uptrend-long positions are opened, and if there is a downtrend, short positions are opened. At the same time, if the indicator line moves parallel to the level 0, then it is recommended not to open trades temporarily in order to avoid a loss.
Signal for Buy trades:
- The indicator line starts moving from bottom to top from level 0, and has a color with a growth value.
Upon receipt of such conditions, a buy trade can be opened on the signal candle, trained by the presence of an upward trend. The trade should be closed when the current trend changes or ends, that is, at the moment when the line changes its direction or color. This will allow considering the opening new trades.
Signal for Sell trades:
- The indicator line, having turned into the color with the value of the fall, should move in the direction from top to bottom.
After receiving such conditions, a sell trade can be opened on the signal candle. It is recommended to close such a trade after changing the color or direction of the line. At this moment, a change or completion of the current downtrend is expected, which in turn will allow considering the opening of new positions.
Conclusion
The RSI of Super Trend indicator is a very accurate trading algorithm based on time-proven indicators. It is also very easy to use and suitable even for beginners who can facilitate trading through preliminary practice on a demo account. For more accurate and profitable trading, it is recommended to use the indicator with other indicators, tools and advisers, while its separate use is also not denied.
You may also be interested The QQE of RSIOMA Trading indicator for MT5


