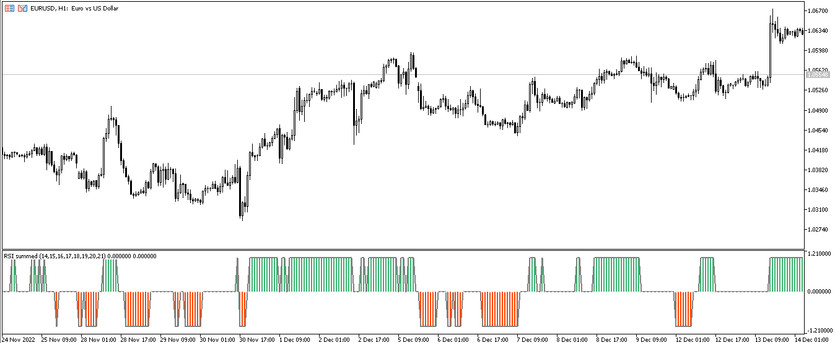
RSI Summed is a trading algorithm based on the functioning of eight RSI indicators of different periods, which in turn is part of standard Forex indicators. It is used for trend trading, that is, the indicator determines the presence and current direction of a trend and allows opening trades during this period .The RSI Summed indicator is displayed in the lower window of the price chart as a colored histogram with a signal line and level 0. Thus, taking into account the calculations of the RSI indicators, namely, taking into account the values of the histogram, the direction of the trend is determined and trades are opened accordingly.
The RSI Summed indicator can be used with any currency pair, on any timeframe.
Input parameters
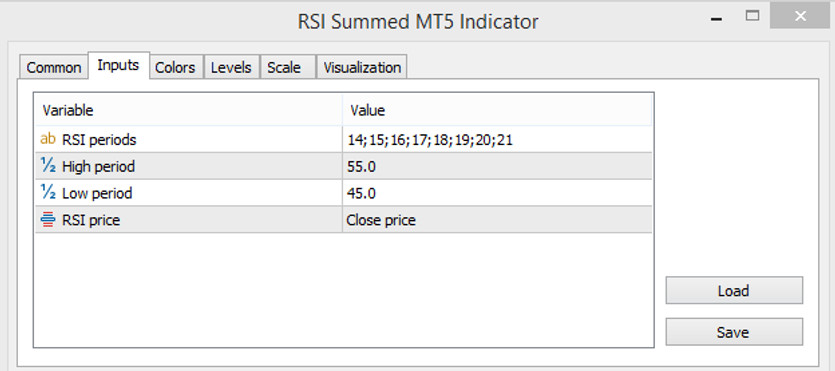
The input parameters in the indicator settings consist of four input parameters, each of which affects its technical operation. The Colors section in its settings is used to change the color gamut and thickness of the values, and the Levels section is used to add signal levels to its window.
- RSI periods - the value of the periods of all eight RSI indicators. The default value is 14;15;16;17;18;19;20;21.
- High period - the highest value used by the indicator. The default value is 55.0.
- Low period - low value of the indicator. The default value is 45.0
- RSI price - the price to which the general values of the indicator are applied. The default value is Close price.

Indicator signals
The algorithm for using the RSI Summed indicator is very simple, but at the same time effective in use. To open a certain trade, the current trend is first determined. To do this, it should be taken into account the direction and color of the current histogram bars and the location of its signal line relative to the signal level. If an uptrend is detected on the market, buy trades are opened, and if the trend is down, sell trades. At the same time, if there are no columns at all, it should be waited a little while opening trades. In both cases, trades are closed at the moment the current trend changes.
Signal for Buy trades:
- The histogram of the indicator forms columns above level 0, like the signal line, and has a color with a growth value.
Upon receipt of such conditions, a long position may be opened on the signal bullish candle, due to the presence of an uptrend in the market. The trade should be closed at the moment the columns completely disappear or their color and direction change. At this moment, it should be considered opening new trades, due to a change in the current trend.
Signal for Sell trades:
- The histogram with the signal line falls below level 0 and is colored with the drop value.
A sell trade can be opened immediately upon receipt of such conditions on a bearish signal candle. At this moment, a downtrend is determined in the market. The trade should be closed when the current trend changes, namely at the moment of a change in the color and direction of the trend or when there are temporary absence of columns. At this moment it can be considered opening new trades.
Conclusion
RSI Summed is a very accurate and efficient trading algorithm based on the interaction of RSI indicators with different periods. The indicator is very easy to use and suitable even for beginners. In order to gain the necessary trading skills and correctly apply the algorithm, preliminary practice on a demo account is recommended.
You may also be interested The MACD Hull trading indicator for MT5


