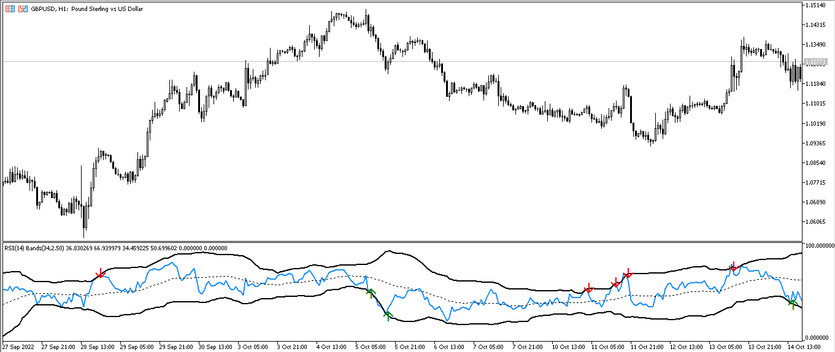
RSI with BB is a developed trading algorithm that is based on a combination of two standard Forex indicators. As the name implies, its calculations are made using the calculations of the RSI and Bollinger Bands indicators. Working with each other, the indicators form common signals, identifying the current trend and finding the best moment to open positions in its direction. In addition, the indicator is suitable for determining whether the current market is in the overbought or oversold zone. The indicator is displayed in the lower window of the price chart as one RSI line and three Bollinger Bands, which, at a certain intersection, draw an arrow of a certain color and directions in this place. It is this arrow that helps to find the position opening candle and determine its direction.
The RSI with BB indicator is suitable for use on absolutely any timeframe, with any currency pair, as it is equally effective with any given units.
Input parameters
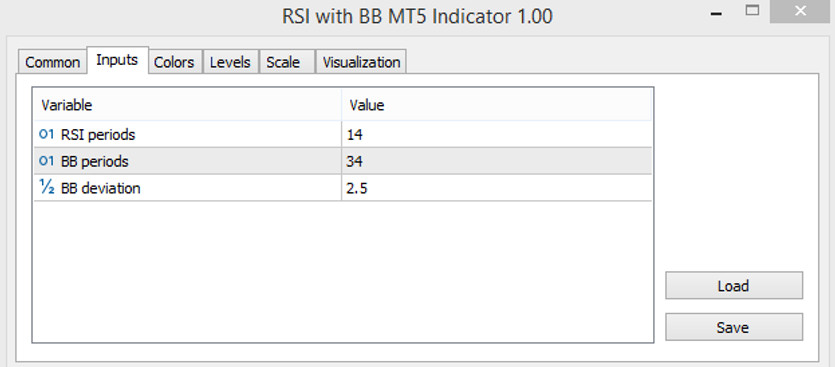
The RSI with BB indicator has only three input parameters in its settings that can be changed for own convenient trading scheme. The Colors section in its settings has the function of changing the color scheme and the thickness of its values, and the Levels section is responsible for adding signal levels to the indicator window.
- RSI Periods - the period of the RSI indicator line. The default value is 14.
- BB Periods - the value of the period of the Bollinger Bands indicator. The default value is 34.
- BB Deviation - parameter responsible for the deviation of the values of the Bollinger Bands indicator. The default value is 2.5.
Indicator signals
Trading using the RSI with BB indicator does not require certain skills and special efforts. In order to open a trade, it is needed to watch for the appearance of an arrow in the indicator window, which will have its own color and direction. The arrow is formed on the chart at the moment when the RSI line goes beyond the upper or lower border of the BB indicator, while crossing its middle line, and depending on their location, an arrow appears at the place of their intersection. And depending on the color values and the direction of the arrow, a position may be opened due to the presence of a trend.
Signal for Buy trades:
- The RSI indicator line goes down, crossing the middle and lower lines of the BB indicator, and thus, at the point where the line crosses with the lower border, an upward arrow is formed and has a color with a growth value.
A long position can be opened on the candle on which such an arrow is formed, conditioned by certain values. Such a trade should be closed immediately after the next arrow forms in the indicator window, allowing open a new trade due to a change in the current uptrend.
Signal for Sell trades:
- An arrow appears in the indicator window, colored in color with the value of the fall, directed downwards. Its appearance is due to the RSI line crossing upwards the middle and upper borders of the BB indicator.
When such an arrow is formed, with the presence of the above conditions, a short position can be opened. It should be closed after a new arrow appears in the indicator window, which makes it possible to open a new trade due to a change in the current trend.
Conclusion
The RSI with BB indicator is a very accurately calculated trading algorithm, thanks to which it can be easily made several trading operations. In order to avoid some difficulties in using the indicator in practice, it is recommended that it first be used a demo account, as well as study the scheme of the indicators on the basis of which this algorithm was compiled.
You may also be interested The Stochastic RSI Trading Indicator for MT5

