The Stochastic RSI is a trading algorithm that is based on the combination of two indicators included in the standard forex set. Based on the interaction of two single-period indicators Stochastic and RSI, an indicator was compiled that can be used for various purposes in trading, for example, to identify the current trend, determining the moment when the market is in the overbought or oversold zone, as well as to identify the optimal moment to open a certain position. Its calculations are very accurate due to careful filtering and smoothing of signals. Although the indicator does not generate signals very often, they are all as accurate as possible.
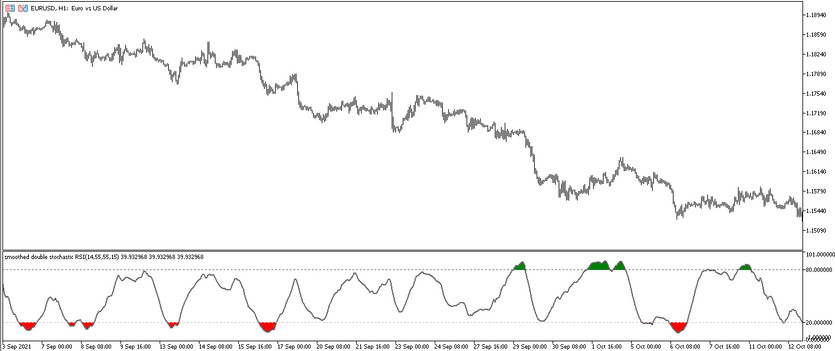
The Stochastic RSI indicator is presented in the lower window of the price chart as a moving average that moves in a certain direction, crossing their signal levels.
Input parameters
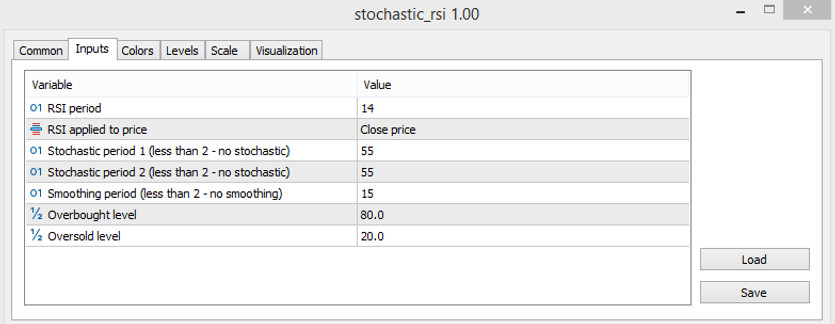
The Stochastic RSI indicator has standard input parameters in its settings, those that affect only the general operation and functioning of the indicator. The remaining sections of its settings are responsible for the color scheme and thickness of its values, as well as adding signal levels to its window, in addition to those already added by default levels are 20 and 80.
- RSI period - parameter responsible for the value of the period of the RSI indicator. The default value is 14.
- RSI applied to price - the price to which RSI indicator calculations are applied. The default is Close price.
- Stochastic period 1(less than 2=no Stochastic) - the period of the first used slow indicator Stochastic. The default value is 55.
- Stochastic period 2(less than 2=no Stochastic) - period of the second Stochastic indicator. Default value is 55.
- Smoothing period 3(less than 2=no Smoothing) - the value of the period of the fast Stochastic indicator. The default value is 15.
- Overbought level - indicator parameter responsible for the value of the indicator's overbought level. The default value is 80.0.
- Oversold level - value of the indicator's oversold level. The default value is 20.0.

Indicator signals
In order to use the indicator in practice, namely to identify the optimal moment for entering the market, it is just needed to follow the direction of the indicator line and its location relative to the oversold or overbought zones, that is, signal levels 20 and 80. Thus, it can be said, that the indicator is not only effective in its calculations, but also very easy to use, so it can be used by traders with different levels of preparedness and professional skills.
Signal for Buy trades:
- The indicator line falls below level 20, after which it changes direction and starts moving up.
As soon as the indicator line rises above level 20, a long position may be opened. It should be closed after the indicator rises above level 80, as this will indicate that the market is in the overbought zone, and at this moment it is better not to trade at all and wait until the line will drop below this level. This will make it possible to open new positions.
Signal for Sell trades:
- The moving average, which has broken through the level of 80 up, starts moving down.
After the indicator line falls below its level of 80, a sell trade can be opened.It is needed to close it after the line falls below level 20, which will indicate that the market is in the oversold zone. During such a period, it is better not to open trades at all, before the line rises above this level, since then it can be considered opening new trades.
Conclusion
The Stochastic RSI indicator is very efficient to use and shows good results, bringing profit from any trade. Despite the ease of use of this indicator, it should not be neglected the use of a demo account, as this will allow mastering all the necessary trading skills.


