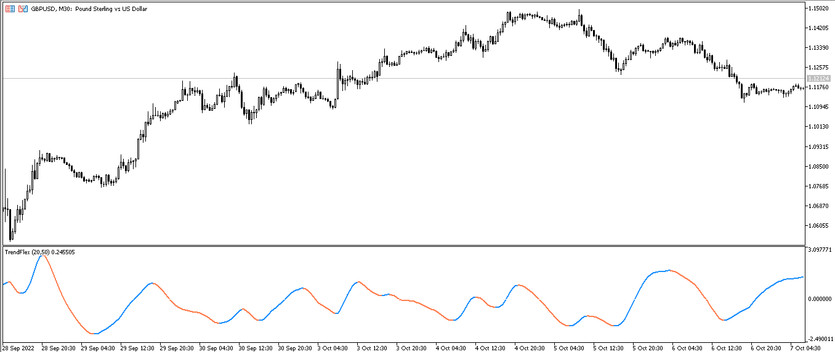
The Trend Flex indicator was developed to quickly and accurately determine the current market trend, thanks to which it is possible to determine the direction of the trade that opens after the market movement is detected, and the search for a candle on which it should be opened. The indicator is displayed in the lower window of the price chart in the form a solid line that changes its color and direction during a certain trend, which are the main determinants of market movement. In its calculations, the indicator uses two lines of different periods, one of which is fast and the other is slow. If the fast line is higher than the slow one, then the market trend is up and the line has a color with a growth value, and if vice versa, then a trend is down and the line is painted in a color with a falling value. And thus, taking into account the color and direction of the indicator line, a certain position can be opened.
The Trend Flex indicator can be used on any timeframe, with any currency pairs. However, to get more profit, it is recommended to use timeframes from M15 to H4, and pairs with high volatility.
Input parameters
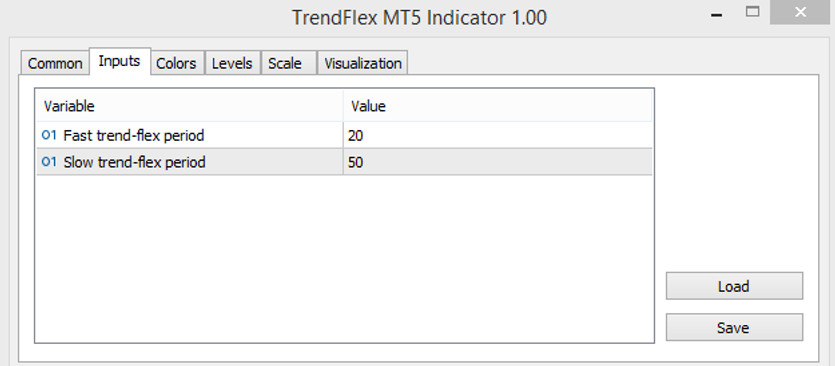
There are two input parameters in the settings of the Trend Flex indicator that are responsible for the operation of two different-period lines of the indicator. The remaining sections in its settings are responsible for changing the color scheme and line thickness, as well as adding additional signal levels to the indicator window.
- Fast trend-flex period - parameter responsible for the period of the indicator's fast line. The default value is 20.
- Slow trend - flex period-value of the period of the indicator's slow line. The default value is 50.
Indicator signals
The Trend Flex indicator is presented as a line, which, depending on the current trend, is painted in a certain color and moves in a certain direction. Thus, it is easy to guess that these two line values will be taken into account when making trades. As soon as the indicator line changes these values, then the trend in the market changes, and this allows opening new trades. If the line moves up and has a color with a growth value, then the current trend is up, and if the line has a color with a fall value and at the same time moves down, then the trend is down.
Signal for Buy trades:
- The line changes its color and acquires a color with a growth value, while starting its movement from the bottom up.
After the indicator acquires such conditions, a buy trade may be opened, due to the presence of an uptrend in the market. Such a trade should be closed immediately after the line changes its color. This will indicate the end of the current trend, and this will make it possible to open new trades.
Signal for Sell trades:
- The indicator line starts moving down, and it is colored with the growth value.
After the indicator line has such parameters, a sell trade can be opened, due to the presence of a downtrend in the market. It should be closed after receiving the opposite conditions, namely, changing the color of the line, as this will indicate the end of the current trend and the beginning of a new one. It will be enable new trades to be opened.
Conclusion
Trend Flex differs not only in ease of use, but also in efficiency from similar indicators. It makes very accurate calculations and thanks to this it can be quickly and easily determined the current trend and opened a trade in its direction. But before using the indicator in practice, it is recommended to use a demo account.
You may also be interested The RSI with BB trading indicator for MT5

