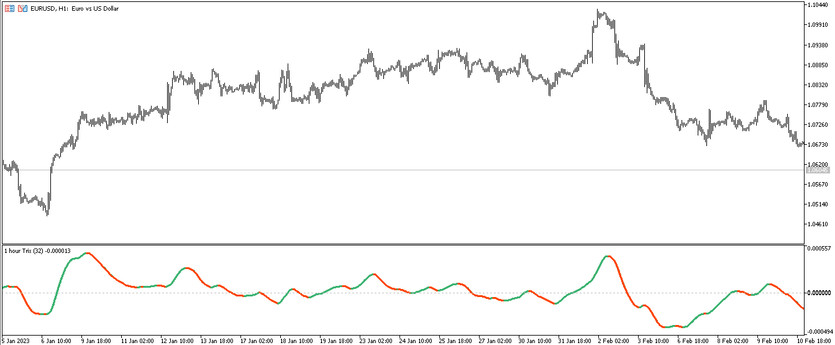
TRIX Pivots is a trend trading indicator based on effective and accurate indicators. To determine the current direction of the trend and trade in this period directly, the indicator uses signals based on the interaction of two algorithms. Since the indicator is a trend indicator, trading is made only during a certain trend period, which is determined taking into account the values of the indicator line. The indicator is displayed in the lower window of the price chart as a solid line of a certain color, direction and location relative to the signal level.
The TRIX Pivots indicator is suitable for any currency pairs and timeframes, while there is a parameter in the indicator settings that is responsible for the multi-timeframe mode.
Input parameters
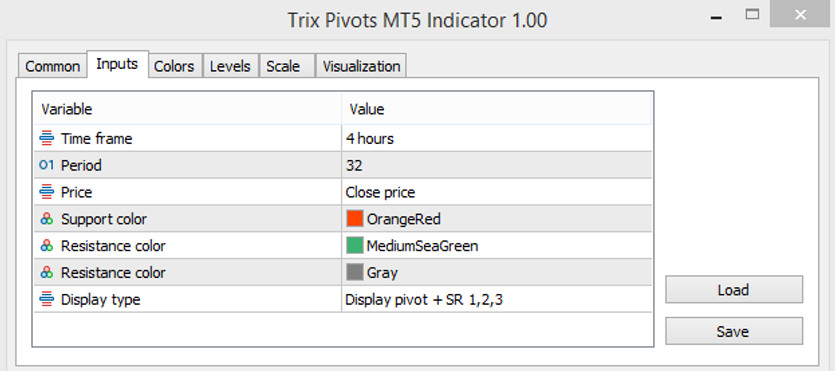
The TRIX Pivots indicator settings consist of several sections. Thus, the Input Parameters section affects its general technical operation. The Colors section is used to change the color scheme and line thickness. Using the Levels section, signal levels can be added to the indicator window.
- Time frame - the timeframe used for the current trade. The default value is 4 hours.
- Period - value of the indicator period. The default value is 32.
- Price - price to which the indicator's calculations are applied. By default, it is set to Close price.
- Support color - line color responsible for support levels. Default value is OrangeRed.
- Resistance color - resistance level color. Default is MediumSeaGreen.
- Resistance color - another color responsible for resistance levels. Default is Gray.
- Display type - parameter responsible for a specific display of indicator values. By default, it has the value Display pivot+SR 1,2,3.

Indicator signals
To open a certain trade using the TRIX Pivots indicator, no effort is required, as it is very simple and straightforward to use. To open a trade using this indicator, the direction of the current trend is first determined. For this, the direction and color of its line are taken into account. If the trend ascending, long positions are opened, if the trend is down, short positions are opened. In both cases, trades are closed at the moment of a trend change.
Signal for Buy trades:
- The indicator line moves from bottom to top, crossing the signal level and it is colored with the growth value.
Upon receipt of such a condition, a buy trade can be opened on a signal bullish candle, due to the presence of an uptrend in the current market. It should be closed at the moment when the indicator line changes direction and turns into a different color. This will determine the change in the current trend, which in turn will allow considering the opening of new trades.
Signal for Sell trades:
- The indicator line has a color with a falling value and moves down under the 0 level.
A sell trade can be opened on a signal bearish candle upon receipt of such conditions. The current conditions will characterize the presence of a downtrend in the market. The trade should be closed at the moment the current trend changes, namely, when the color and direction of the indicator line changes. At this time new trades can be considered to be opened.
Conclusion
The TRIX Pivots indicator is a fairly simple, but at the same time very subtle and effective trading algorithm that allows trading with the trend. To filter and avoid the formation of false signals, it is recommended to use the indicator with additional indicators, filters or advisors. Before trading on a real deposit, it is recommended to use demo account.
You may also be interested Trend trading indicator Normalized MACD of Averages for MT5


