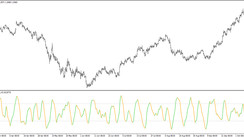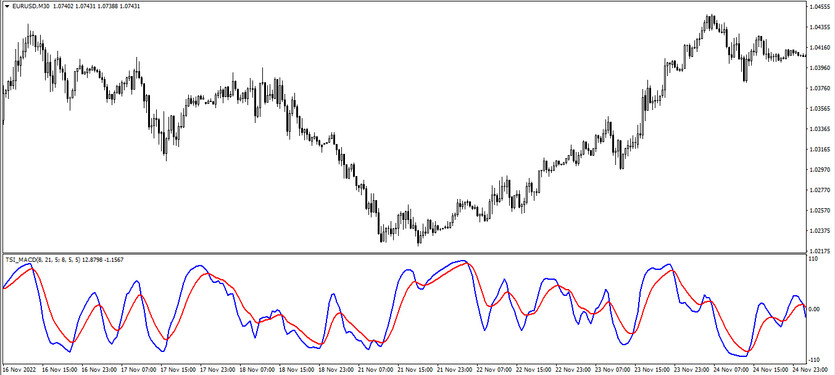
The TSI MACD is a trend oscillator that was developed based on the interaction of two indicators, namely MACD and TSI (True Strength Index). To make calculations, the indicator uses the work of both indicators, while the initial calculation does not come from price momentum as in TSI, but from the MACD values, that is, it is calculated as the difference between the MACD value on the last bar with the MACD value on the previous one. Thus, the indicator calculations make it easier to trade by quickly determining the current trend and opening positions in this period. It is displayed in the lower window of the price chart in the form of two lines that have a certain color, while intersecting with each other, moving in a certain direction.
The TSI MACD indicator is suitable for trading any currency pairs, on any timeframe.
Input parameters
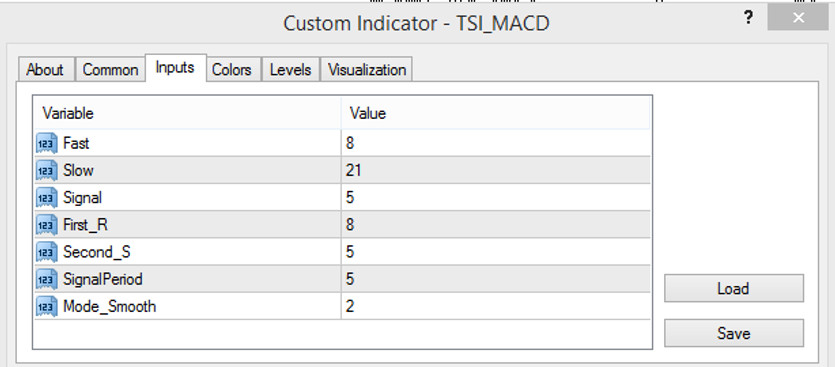
The TSI MACD settings consist of seven input parameters, each of which, to one degree or another, serves to change some technical factors of the indicator. There are also additional sections in its settings, for example, Colors is used to change its color scheme and thickness, and the Levels section is used to add additional signal levels to the indicator window.
- Fast - period of the fast exponential moving average of the MACD indicator used in calculations. The default value is 8.
- Slow - period of the slow moving average of the MACD indicator. The default value is 21.
- Signal - the period of the signal exponential moving average of the indicator. The default value is 5.
- First R - period of the first smoothing line of the indicator. The default value is 8.
- Second S - value of the period of the second smoothing line of the indicator. The default value is 5.
- Signal Period - period of the signal line. The default value is 5.
- Mode Smooth - type of smoothing of the indicator calculations. The default value is 2.
Indicator signals
To open certain trades using the TSI MACD indicator, the current trend is determined. For this, some indicator factors should be taken into account, namely its lines intersection and common direction. And thus, if conditions characterizing an uptrend match on a certain candle, long positions can be opened, while if the conditions characterize a downtrend, short positions are opened. Any trade opened with the TSI MACD indicator should be closed after receiving opposite indicator signal, that is, when opposite conditions appear.
Signal for Buy trades:
- The indicator lines intersect so that the fast line is higher than the slow one, while both lines should move up.
Upon receipt of such conditions characterizing an upward market trend, a long position can be opened on a signal bullish candle. It should be closed after the indicator lines change their intersection and direction. At this moment, it should be prepared to change the current trend and open new positions.
Signal for Sell trades:
- The indicator lines move from top to bottom and intersect so that the line with the falling value is higher than the line with the rising value.
A short position can be opened immediately after receiving such conditions on a signal bearish candle. It is recommended to close the position after receiving the opposite conditions, namely, when the intersection and direction of the lines change. At this moment, it should be prepared to change the current downward trend and open new trades.
Conclusion
The TSI MACD indicator is very effective, as it is based on very accurate trading algorithms, the effectiveness of which has been proven by time. At the same time, in order to obtain more accurate and correct signals, it is recommended to use additional indicators, filters and tools. Its use is not very difficult, however, in order to gain the necessary trading skills, the using of a demo account is recommended.
You may also be interested The RSX NRP Coronforex Signal trading indicator for MT4