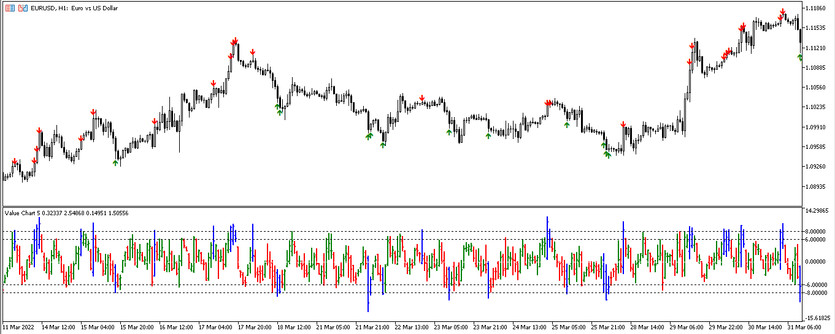
The Value Charts is a developed version of an arrow indicator designed to identify entry and exit points from the market. The indicator greatly simplifies the trading conditions, not only due to the fact that it draws arrows on the current chart, which, by their direction and color, indicate the possibility of opening a certain position, but and due to the fact that Value Charts, in addition to the fact that in the main window the indicator is presented in the form of arrows, in the lower window, it is made in the form of colored bars that, under the prevailing market conditions, cross levels -6, -8.6 and 8 , heading down or up and turning into one of three colors. The indicator does not lose its effectiveness on any timeframe or currency chart, which makes it universal.
Input parameters
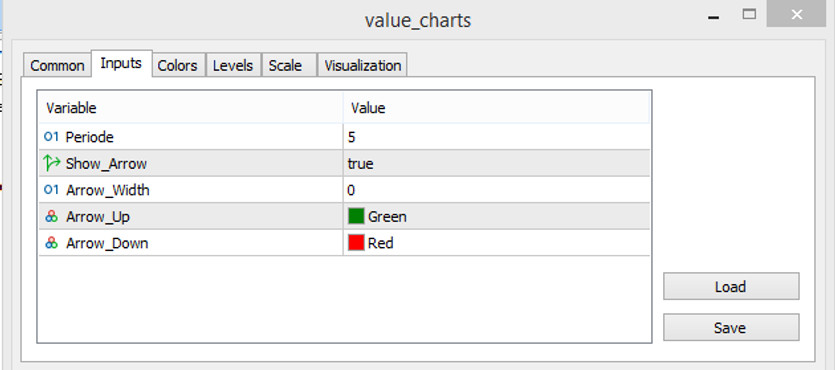
The Value Charts in its settings has five input parameters that are responsible for the overall operation of the indicator. Some of them are responsible for the visualization of the indicator, and others for its technical work. However, identical to all indicators, there are sections in the Value Charts settings that are responsible for the color and width of its values, as well as adding additional levels to the indicator window.
- Period - indicator calculation period. The default value is 5.
- Show Arrow - parameter responsible for drawing arrows in the main window of the price chart. The default value is true.
- Arrow Width - arrow width parameter. Default value is 0.
- Arrow Up - the color of the arrow with the growth value. The default value is Green.
- Arrow Down - parameter responsible for the color of the arrow with a falling value. The default value is Red.

Indicator signals
The signal to open positions of the Value Charts indicator is considered after the next arrow has formed on the price chart, and according to the principle of all identical indicators, the trade is opened taking into account the color and direction of the arrow. However, if the Show Arrow parameter is set to false, then the arrows on the chart will not appear, and for trades will be considered bars in the indicator window, which change their color and move up or down, crossing their levels.
Signal for Buy trades:
- On the chart, under a certain candle, a color arrow with a growth value is formed, directed upwards.
- At the same time, the bar below it should also have a growth value and move up, crossing levels -6 and -8.
Upon receipt of such conditions, a long position can be opened on a certain candle, which should be closed after another arrow appears on the chart, as this is considered as a new signal to open a new and close the old position, or if the bar in the lower indicator window changes color to opposite.
Signal for Sell trades:
- -An arrow should form above a certain candle, pointing down, that is, with the value of the fall.
- In the indicator window under this candle, a bar with a fall value should form, which crossed levels 6 and 8 from top to bottom.
After taking into account all the conditions, an arrow is formed above a certain candle, a sell trade can be opened. Such a trade should be closed if a new arrow appears on the price chart, which can serve as a new signal to open a position or if the bar in the indicator window changes color.
Conclusion
The Value Charts indicator is great for both long-term and short-term trading. It will depend on the market conditions under which the arrow is formed on the chart. The indicator itself is very easy to use, so it can be used by traders of different levels of preparedness, which can be strengthened by account good practice on a demo account.


