This overview specifically introduces the basics of trading on the R StocksTrader platform. This is RoboForex's unique multi-market network platform, allowing traders to access various market asset groups and thousands of tools.
In this article, only the desktop version is discussed, but it has apps for iOS and Android, suitable for traders who like to control their positions from anywhere in the world.
What are the advantages of R StocksTrader?
R StocksTrader provides access to a wide variety of assets, such as stocks, indices, oil, metals, foreign exchange and ETFs. The total number of instruments on this platform currently exceeds 12,000.
The platform also has a trading strategy builder, allowing you to create your own automated trading system.
Find more detailed information about the R StocksTrader platform in this article.
Open a trading account
To start using R StocksTrader, you need to open an account. First, register a personal member area on the RoboForex website, and then select R StocksTrader on the "Open Account" page.
In the account opening window, you can customize the following parameters:
- Real or simulated (virtual currency) account.
- Hedging tracking system: yes or no (it allows multiple positions, including one asset and different directions).
- Account currency: U.S. dollar or Euro.
- Leverage: from 1:1 to 1:20.
R StocksTrader interface
To enter the platform, please visit https://stockstrader.roboforex.com.
You can learn the interface and main functions through the "Continue as guest" option without registering an account.
Top menu of the platform
In the top menu bar of the platform, there are two active buttons and your current account information.
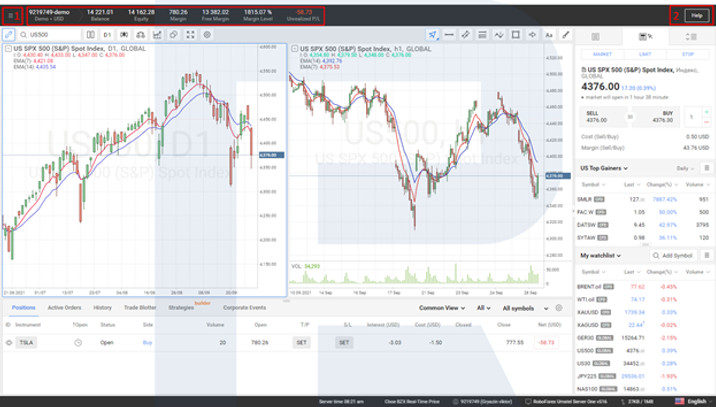
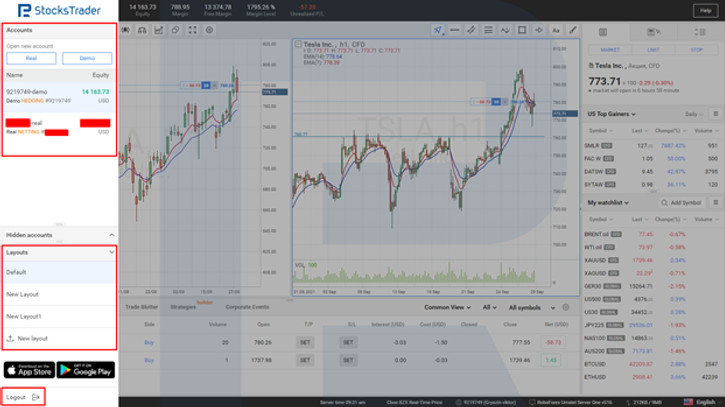
- Button 1 opens the trading account menu (where you can sell various chart and indicator settings). Through this menu, you can switch from one account to another and switch between preset desktops. At the bottom of the menu, there is an exit button.
- Button 2 is a support button. Click this button and you will open the platform support page, which provides you with the necessary information about platform features.
Working with charts
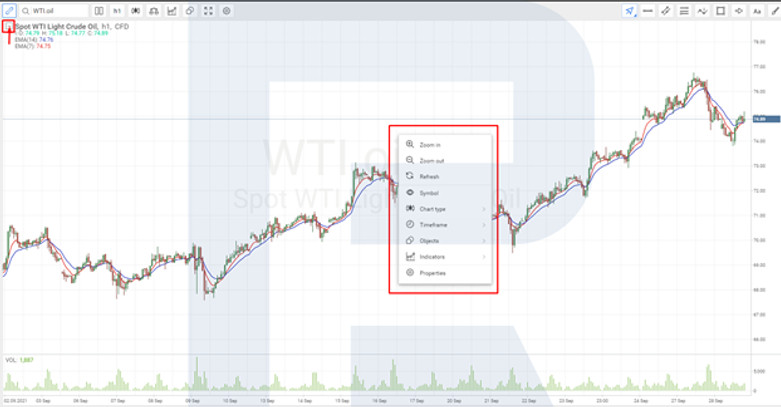
The central part of the desktop is occupied by the chart. The setting and editing buttons are at the top.
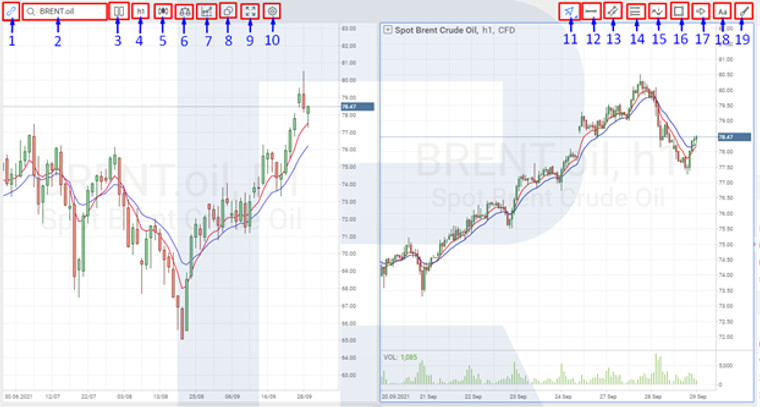
In addition, in the upper left corner of the chart, there is a small square. Click it to expand/collapse price parameters (opening price, high price, low price, closing price) and indicator value. Right-click anywhere on the chart to open a window with certain functions from the upper panel.
Trading panel
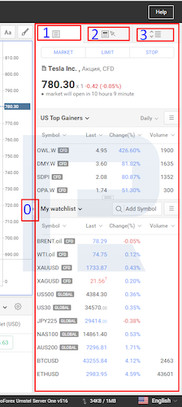
The right part of the desktop is a trading panel with a watch list of tools. It has three pages (1, 2, 3), and there is a fold/unfold button in the middle on the left (marked as 0 in the figure below).
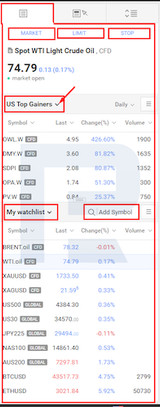
Page 1-The name of the instrument and its current offer. There are three buttons near it, which are used to open the trading operation window:
- Market-open a position at the current market price
- Limit price – place a limit order
- Stop Loss-the next stop loss pending order
Below are two customizable watch lists. For example, in the first watch list, you can choose from a set of system tools in the expanded menu: the United States, the United Kingdom, and Germany have the highest gains/falls/volume leaders.
In the second case, you can set up your own watch list and add tools through the Add Symbol window.
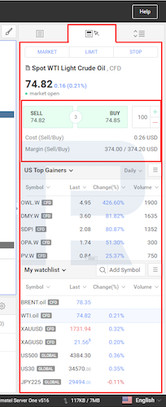
Page 2 - Extended trading panel with active sell and buy buttons showing current buy/sell prices.
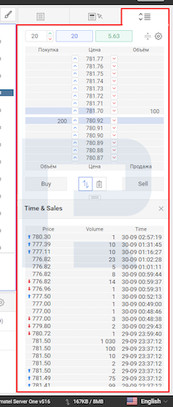
Page 3 - It opens up the market depth where you can trade directly. Below is the transaction source window, which displays the price, quantity, and time of trading using this tool on the exchange.
Current position window
At the bottom of the desktop, there is a window showing open positions and active pending orders.
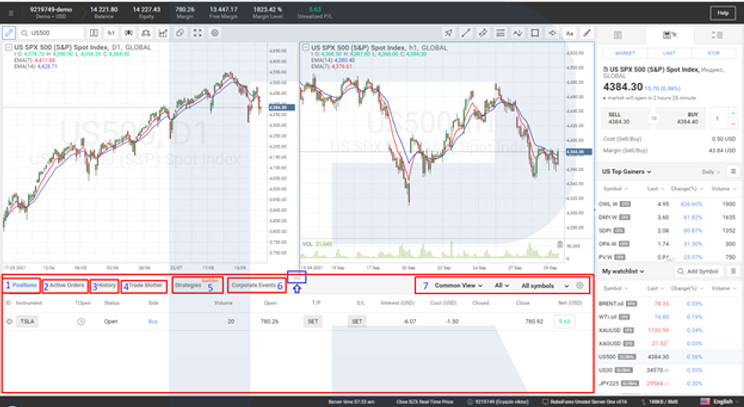
This window has several pages:
1. Position-reflects all open positions.
2. Active orders-reflect all active pending orders.
3. History-shows the trading history of a certain period of time.
4. Orders (order log)-reflects all executed and cancelled orders.
5. Strategies (constructor)-Demonstrates the built-in popular automatic strategies and allows you to create your own strategies.
Find more detailed information about writing your own expert advisors in R StocksTrader in the corresponding article. 6. Company activities-display a list of important company activities in the past and planned: annual reports, dividends, splits. 7. Data representation menu.
Bottom line
The R StocksTrader platform combines modern technology with a classic and user-friendly design. Through it, traders can access a variety of trading tools. One does not require much time to master the platform; it is intuitive and easy to use. Check the detailed trading conditions on the RoboForex website.

