Stock volatility refers to the range of price changes a security or market index undergoes within a specific timeframe. For day traders, it's typically measured by the average deviation between a stock's daily peak and trough, relative to the stock price. For example, a stock trading at $50 per share that fluctuates $5 each day is more volatile than a $150 stock that swings the same amount because the former exhibits a greater percentage movement.
The appeal of trading high-volatility stocks lies in their potential for high profits. However, navigating these waters comes with inherent risks, leading traders to often grapple with two key questions: How can one identify the most volatile stocks, and what strategies can one employ to trade them effectively?
Unearthing the Most Volatile Stocks
The task of pinpointing the most volatile stocks has been simplified significantly, thanks to technology. There's no longer a need for continual research or stock screening. Rather, traders can employ an ongoing screener that identifies consistently volatile stocks.
StockFetcher is a tool that enables you to track high-volatility stocks with ease. By applying customizable filters, you can select stocks exhibiting an average daily movement of more than 5% over the last 100 days.
Volume also plays a crucial role when trading volatile stocks, ensuring smooth entries and exits. With StockFetcher, you can further filter stocks priced between $10 and $100, boasting an average daily volume exceeding 4 million over the past month. If you're focused solely on stocks and not exchange-traded products, incorporating a filter like "exchange is not Amex" can help eliminate leveraged ETFs from your search results.
For those who prefer a more hands-on approach, platforms like Finviz.com provide free tools to identify daily top gainers, top losers, and most volatile stocks. Their screener tool can help refine results based on market capitalization, performance, and volume. NASDAQ also provides unfiltered lists of the largest gainers and losers on the NASDAQ, NYSE, and AMEX exchanges. However, these lists only reflect daily volatility, and traders would need to individually examine the stocks to identify those with a history of volatility and sufficient trading volume.
Trading Strategies for High-Volatility Stocks
Trading volatile stocks requires a keen eye for sharp price movements, patience for the right entry points, and agility in executing trades. A mix of technical indicators and price action monitoring can significantly help. Here's a look at two technical indicators and how to use them effectively.
Keltner Channels
Keltner Channels play a significant role as a key tool for interacting with unpredictable stocks that exhibit strong trends. When you're dealing with volatile stocks that have established a clear direction, these channels can serve as invaluable guides for your trading decisions.
Think of a Keltner Channel as a three-lane highway where the stock price can move. The middle band represents the moving average, typically a 20-day exponential moving average (EMA), which serves as the central vein of the channel. Two outer bands, calculated based on Average True Range (ATR), form the outer boundaries and expand or contract with the volatility.
When dealing with a trending stock, the price tends to hug the upper or lower band, rarely retreating to the middle band. In the case of an uptrend, for example, you should seek entry points when the price touches the middle band, effectively retracing its steps before continuing its upward trajectory. However, ensure the trend is strong by verifying that the price makes higher highs and lower lows.
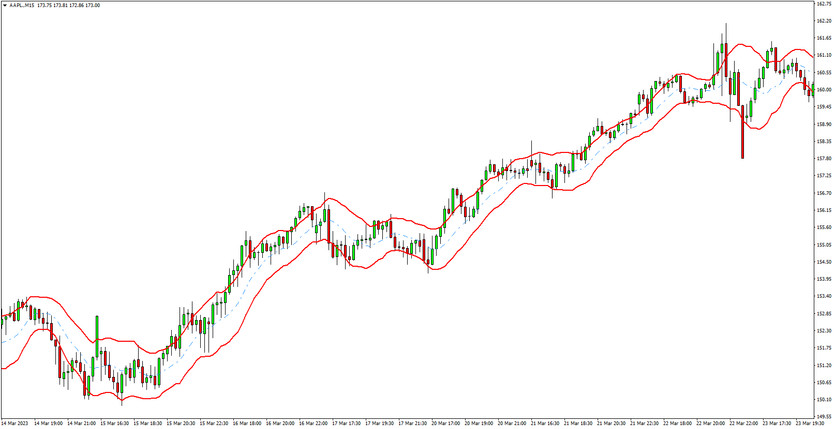 Keltner Channels indicator - Apple stock, 15-min time frame
In a downtrend, you might consider shorting the stock when it hits the middle band, anticipating a resumption of the downward move. Similarly, ensure that the trend is strong by confirming lower highs and lower lows in the price pattern.
Placing stop orders is equally critical to manage your risks. Set stops at the opposite band; in an uptrend, place your stop order below the lower band and in a downtrend, place it above the upper band. Aim to exit the trade near the band the price is hugging, or when the price fails to reach the band on a pullback, which often signifies the end of a trend.
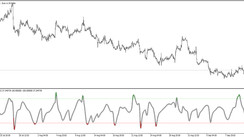
Stochastic Oscillator
The stochastic oscillator works well with range-bound stocks or those lacking a defined trend. It can provide confirmation of a reversal, particularly valuable as volatile stocks often enter a range before deciding their next direction.
Stochastic oscillators serve as a second instrumental tool, particularly when dealing with volatile stocks lacking a defined trend. Often, volatile stocks will enter a range before making a decisive move in a particular direction. Given the swift movement of these stocks, waiting for a confirmation of a reversal proves sensible, and this is where stochastic oscillators come into play.
When a stock's movement lacks direction and primarily fluctuates sideways, consider selling near the peak of the range once the stochastic surpasses 80 and then drops below it. Your stop order should be placed just above the recently formed high, with a target set 75% down the range. For example, if the range has a $10 high (low to high), your target should be $2.50 above the low.
In contrast, you can take long positions near the bottom of the range when the stochastic falls below 20 and then bounces back above it. Position your stop just below the recent low, targeting 75% up the range. For a range with a $10 high, your target should be $2.50 below the high.
Swiftly take trades as soon as the price crosses the stochastic trigger level (80 or 20). Waiting for the price bar to complete could lead to the price moving too far towards the target, making the trade less profitable. Disregard contrary signals while in a trade, allowing the target or stop to be hit. If the stock continues to range after hitting the target, a signal in the opposite direction will soon develop.
Understand that while this strategy helps you anticipate favorable price levels, it may provide false signals or signals that come too late. That is, when the indicator crosses the 80 line (for shorts) or 20 line (for longs), you might incur losses before the profitable move emerges. When the entry signals occur, the price may have already made significant moves towards the target, thereby reducing the profit potential and possibly rendering the trade unworthy. Upon entry, the reward should ideally be 1.5 times greater than the risk, based on the target and stop.
Key Takeaways
Volatile stocks captivate traders due to their rapid profit potential. When volatile stocks trend, they typically present the highest profit potential, as there's a directional bias to aid decision-making. Keltner channels shine in strong trends, where the price often only retracts to the middle band, providing an entry point. However, the pitfall lies in the fact that once the trend ends, losses are inevitable. Monitoring price action to ensure that the price is making a higher high and lower low before entering an uptrend trade will help alleviate this issue.
On the other hand, volatile stocks often swing back and forth without always trending. During these range-bound periods, stochastic oscillators become useful as they can indicate the continuation of a range and provide trading opportunities. Keeping an eye on both the stochastic oscillator and Keltner channels will help you react to either trending or ranging opportunities. Bear in mind that no indicator is flawless, and keeping a constant eye on price action will help you discern when the market is trending or ranging, allowing you to use the right tool.
Volatile stocks, with their rapid price action and momentum, are an attractive proposition for traders. Successful trading in this arena requires a firm grasp of technical analysis and an understanding of chart patterns and indicators. Both Keltner Channels and the stochastic oscillator provide actionable insights and are valuable tools for traders.